downloadGroupGroupnoun_press release_995423_000000 copyGroupnoun_Feed_96767_000000Group 19noun_pictures_1817522_000000Member company iconResource item iconStore item iconGroup 19Group 19noun_Photo_2085192_000000 Copynoun_presentation_2096081_000000Group 19Group Copy 7noun_webinar_692730_000000Path
Skip to main content
Default Banner Image

SEMI Press Release

ID
semi-press-release

SINGAPORE — July 27, 2021 — With the resurgence of COVID-19 cases in Southeast Asia, SEMI, the global industry association representing the electronics manufacturing and design supply chain, today announced that SEMICON Southeast Asia (SEA) – 23-27 August 2021 – will be held as a virtual platform to ensure the safety of exhibitors, partners and guests. Registration is open.

SEMICON SEA 2021 Virtual logoSEMICON SEA 2021 will gather industry experts to highlight the latest developments, innovations and trends in segments of electronics and semiconductors including smart manufacturing, smart mobility, smart data, AI and 5G as technology continues to reshape the way people work and live. SEMICON SEA is the premier electronics manufacturing event in Southeast Asia.

Themed Powering Innovation – 5G and Beyond, SEMICON SEA 2021 Virtual will consist of the following two segments:

  • 23-25 August 2021 – A 3-day conference offering a compelling range of plenary and conference sessions.
  • 23-27 August 2021 – A complimentary exposition for attendees with business-matching, chat rooms, a new online networking lounge, the popular Meet-the-Experts lounge for updates on the latest technology developments and other opportunities to help exhibitors and attendees grow their businesses.

The health and safety of SEMICON SEA 2021 participants is SEMI’s top priority. Staging SEMICON SEA 2021 as a virtual event is part of SEMI’s commitment to protecting participants while ensuring uninterrupted business exchanges and opportunities for them to expand their industry connections.


About SEMI

SEMI® connects more than 2,400 member companies and 1.3 million professionals worldwide to advance the technology and business of electronics design and manufacturing. SEMI members are responsible for the innovations in materials, design, equipment, software, devices, and services that enable smarter, faster, more powerful, and more affordable electronic products. Electronic System Design Alliance (ESD Alliance), FlexTech, the Fab Owners Alliance (FOA) and the MEMS & Sensors Industry Group (MSIG) are SEMI Strategic Association Partners, defined communities within SEMI focused on specific technologies. Visit www.semi.org to learn more, contact one of our worldwide offices, and connect with SEMI on LinkedIn and Twitter.


Association Contact

Travers Lim/SEMI

Program and Marketing Manager
Phone: 65.6391.9519
Email: [email protected]

MILPITAS, Calif. — July 26, 2021 — North America-based semiconductor equipment manufacturers posted $3.67 billion in billings worldwide in June 2021 (three-month average basis), according to the June Equipment Market Data Subscription (EMDS) Billings Report published today by SEMI. The billings figure is 2.3% higher than final May 2021 billings of $3.59 billion and 58.4% higher than June 2020 billings of $2.32 billion.

SEMI logo“The semiconductor equipment market demonstrated extraordinary growth in the first half of 2021,” said Ajit Manocha, SEMI president and CEO. “We are witnessing a structural shift in the industry marked by higher capital investments as demand for the semiconductors needed to power technologies unleashed by innovation and the digitization of economies continues to grow.”

The SEMI Billings report uses three-month moving averages of worldwide billings for North American-based semiconductor equipment manufacturers. Billings figures are in millions of U.S. dollars.


Billings
(3-mo. Avg.)

Year-Over-Year

January 2021

$3,038.2

29.8%

February 2021

$3,143.1

32.4%

March 2021

$3,273.9

47.9%

April 2021

$3,428.9

50.3%

May 2021 (final)

$3,588.5

53.1%

June 2021 (prelim)

$3,671.3

58.4%

Source: SEMI (www.semi.org), July 2021


SEMI publishes a monthly North American Billings report and issues the Worldwide Semiconductor Equipment Market Statistics (WWSEMS) report in collaboration with the Semiconductor Equipment Association of Japan (SEAJ). The WWSEMS report currently reports billings by 24 equipment segments and by seven end market regions. SEMI also has a long history of tracking semiconductor industry fab investments in detail on a company-by-company and fab-by-fab basis in its World Fab Forecast and SEMI FabView databases. These powerful tools provide access to spending forecasts, capacity ramp, technology transitions, and other information for over 1,000 fabs worldwide. For an overview of available SEMI market data, please visit www.semi.org/en/MarketInfo.

The data contained in this release were compiled by David Powell, Inc., an independent financial services firm, without audit, from data submitted directly by the participants. SEMI and David Powell, Inc. assume no responsibility for the accuracy of the underlying data.


About SEMI

SEMI® connects more than 2,400 member companies and 1.3 million professionals worldwide to advance the technology and business of electronics design and manufacturing. SEMI members are responsible for the innovations in materials, design, equipment, software, devices, and services that enable smarter, faster, more powerful, and more affordable electronic products. Electronic System Design Alliance (ESD Alliance), FlexTech, the Fab Owners Alliance (FOA) and the MEMS & Sensors Industry Group (MSIG) are SEMI Strategic Technology Communities, defined communities within SEMI focused on specific technologies. Visit www.semi.org to learn more, contact one of our worldwide offices, and connect with SEMI on LinkedIn and Twitter.


Association Contact

Michael Hall/SEMI
Phone: 1.408.943.7988
Email: [email protected]


Notes

Next SEMI Billings report is August 23, 2021 at 3:00pm Pacific.

For information on SEAJ Billings Express Report, visit www.seaj.or.jp. 

MILPITAS, Calif. — July 27, 2021 — Worldwide silicon wafer area shipments increased 6% to 3,534 million square inches in the second quarter of 2021, surpassing the historical high set in the first quarter, the SEMI Silicon Manufacturers Group (SMG) reported in its quarterly analysis of the silicon wafer industry. Second quarter 2021 silicon wafer shipments grew 12% from the 3,152 million square inches recorded during the same quarter last year.

SEMI logo“Demand for silicon continues to see strong growth driven by multiple end-applications,” said Neil Weaver, chairman SEMI SMG and Vice President, Product Development and Applications Engineering at Shin Etsu Handotai America. “The supply of silicon for both 300mm and 200mm applications is tightening as demand continues to outstrip supply.”
 

Silicon Area Shipment Trends – Semiconductor Applications Only


Millions of Square Inches


1Q 2020

2Q 2020

3Q 2020

4Q 2020

1Q 2021

2Q 2021

Total

2,920 

3,152

3,135

3,200

3,337

3,534

                                                                                           Source: SEMI (www.semi.org), July 2021


Data cited in this release include polished silicon wafers such as virgin test and epitaxial silicon wafers, as well as non-polished silicon wafers shipped to end users.

Silicon wafers are the fundamental building material for the majority of semiconductors, which are vital components of all electronics including computers, telecommunications products, and consumer devices. The highly engineered thin disks are produced in diameters of up to 12 inches and serve as the substrate material on which most semiconductor devices, or chips, are fabricated.

The SMG is a sub-committee of the SEMI Electronic Materials Group (EMG) and is open to SEMI members involved in manufacturing polycrystalline silicon, monocrystalline silicon or silicon wafers (e.g., as cut, polished, epi). The purpose of the SMG is to facilitate collective efforts on issues related to the silicon industry including the development of market information and statistics on the silicon industry and the semiconductor market.

For more information, please visit SEMI Worldwide Silicon Wafer Shipment Statistics.


About SEMI

SEMI® connects more than 2,400 member companies and 1.3 million professionals worldwide to advance the technology and business of electronics design and manufacturing. SEMI members are responsible for the innovations in materials, design, equipment, software, devices, and services that enable smarter, faster, more powerful, and more affordable electronic products. Electronic System Design Alliance (ESD Alliance), FlexTech, the Fab Owners Alliance (FOA) and the MEMS & Sensors Industry Group (MSIG) are SEMI Strategic Association Partners, defined communities within SEMI focused on specific technologies. Visit www.semi.org to learn more, contact one of our worldwide offices, and connect with SEMI on LinkedIn and Twitter.


Association Contact

Michael Hall/SEMI
Phone: 1.408.943.7988
Email: [email protected]

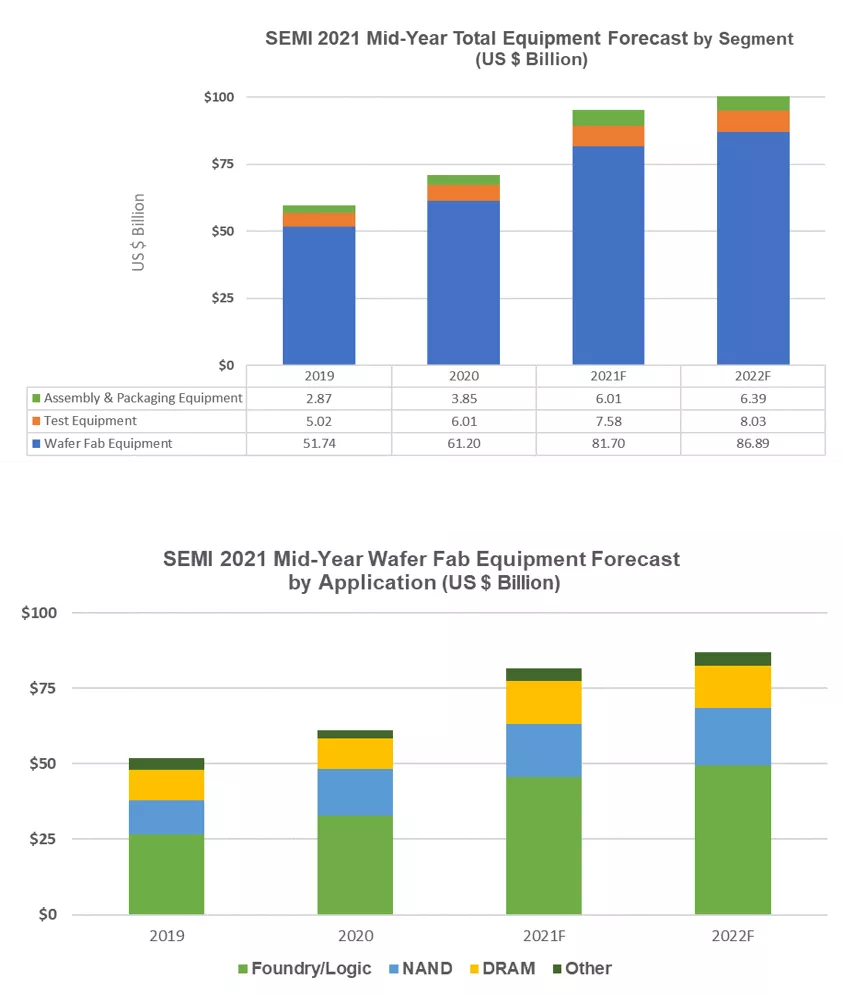
MILPITAS, Calif. — July 13, 2021 — Global sales of semiconductor manufacturing equipment by original equipment manufacturers are forecast to surpass $100 billion next year, a new high, after jumping 34% to $95.3 billion in 2021 compared to $71.1 billion in 2020, SEMI announced today in releasing its Mid-Year Total Semiconductor Equipment Forecast – OEM Perspective at the Innovation for a Transforming World virtual conference. Continuing investments by device makers in secular growth drivers are fueling the expansion of both the front-end and back-end semiconductor equipment segments.

SEMI logoThe wafer fab equipment segment, which includes wafer processing, fab facilities, and mask/reticle equipment, is projected to surge 34% to a new industry record of $81.7 billion in 2021, followed by a 6% increase in 2022 to more than $86 billion.

The foundry and logic segments, accounting for more than a half of total wafer fab equipment sales, will grow 39% year-over-year to reach $45.7 billion in 2021 on strong demand for leading-edge technologies powered by the digitization of industries worldwide. The growth momentum is expected to continue in 2022 with the foundry and logic equipment investments rising another 8%.

Robust demand for memory and storage are driving spending on NAND and DRAM manufacturing equipment. The DRAM equipment segment is expected to lead the expansion in 2021, surging 46% to surpass $14 billion. The NAND flash equipment market is projected to increase 13% in 2021 to $17.4 billion and 9% in 2022 to $18.9 billion, respectively.

The assembly and packaging equipment segment is forecast to grow 56% to $6 billion in 2021, followed by a 6% increase in 2022, driven by advanced packaging applications. The semiconductor test equipment market is expected to grow 26% in 2021 to $7.6 billion and expand another 6% in 2022 on demand for 5G and high-performance computing (HPC) applications.

Regionally, Korea, Taiwan and China are projected to remain the top three destinations for equipment spending in 2021, with Korea at the top on the strength of a robust memory recovery and strong investments in leading-edge logic and foundry. Equipment spending for all regions tracked are expected to grow in 2021.   

The following results reflect market size by segment and application in billions of U.S. dollars:
 

2021 Mid-Year Forecast charts

Source: SEMI July 2021, Equipment Market Data Subscription


New equipment includes wafer fab, test, and assembly & packaging. Total equipment excludes wafer manufacturing equipment. Totals may not add due to rounding.


The current SEMI forecast is based on collective input from top equipment suppliers, the SEMI Worldwide Semiconductor Equipment Market Statistics (WWSEMS) data collection program and the industry-recognized SEMI World Fab Forecast database.

The Equipment Market Data Subscription (EMDS) from SEMI provides comprehensive market data for the global semiconductor equipment market. A subscription includes three reports:

  • Monthly SEMI NA Billings Report, an early perspective of equipment market trends
  • Monthly WWSEMS, a detailed report of semiconductor equipment billings for seven regions and more than 22 market segments
  • Bi-annual Total Semiconductor Equipment Forecast – OEM Perspective, an outlook for the semiconductor equipment market

For more information online, please visit the SEMI EMDS page.


About SEMI

SEMI® connects more than 2,400 member companies and 1.3 million professionals worldwide to advance the technology and business of electronics design and manufacturing. SEMI members are responsible for the innovations in materials, design, equipment, software, devices, and services that enable smarter, faster, more powerful, and more affordable electronic products. Electronic System Design Alliance (ESD Alliance), FlexTech, the Fab Owners Alliance (FOA) and the MEMS & Sensors Industry Group (MSIG) are SEMI Strategic Technology Communities, defined communities within SEMI focused on specific technologies. Visit www.semi.org to learn more, contact one of our worldwide offices, and connect with SEMI on LinkedIn and Twitter.


Association Contact

Michael Hall/SEMI
Phone: 1.408.943.7988
Email: [email protected]

Industry Reports 17% Revenue Growth in Q1 2021

MILPITAS, Calif. — July 14, 2021 — Electronic System Design (ESD) industry revenue increased 17% to $3,157.17 million in Q1 2021, the strongest first-quarter growth ever, the ESD Alliance, a SEMI Technology Community, announced today in the Q1 2021 Electronic Design Market Data (EDMD) report. The first-quarter revenue compares to $2,698 million in Q1 2020. The four-quarter moving average, which compares the most recent four quarters to the prior four, rose 15%, the highest annual growth since 2011.

SEMI ESDA logo“The industry reported substantial, double-digit year-over-year revenue growth for Q1 2021,” said Walden C. Rhines, Executive Sponsor, SEMI Electronic Design Market Data report. “All product categories significantly contributed, with double-digit growth in the Computer Aided Engineering (CAE), IC Physical Design and Verification, Printed Circuit Board and Multi-Chip Module (PCB and MCM), and Semiconductor IP (SIP) segments.”

“Geographically, the Americas; Europe, Middle East, and Africa (EMEA); and Asia Pacific (APAC) also reported double-digit growth,” Rhines said. “Q1 2021 marked a new high for quarterly growth of total license and maintenance revenue, as well as IC physical design and verification.”

The companies tracked in the EDMD report employed 49,024 people in Q1 2021, a 6.7% increase over the Q1 2020 headcount of 45,938 and up 1.1% compared to Q4 2020.

The quarterly EDMD report contains detailed revenue information with the following category and geographic breakdowns.

Revenue by Product and Application Category

  • CAE revenue increased 14% to $974.1 million compared to Q1 2020. The four-quarter CAE moving average increased 12.5%.
  • IC Physical Design and Verification revenue surged 34.4% to $682.5 million compared to Q1 2020. The four-quarter moving average for the category rose 23.6%.
  • Printed Circuit Board and Multi-Chip Module (PCB and MCM) revenue increased 15.3% to $289.2 million compared to Q1 2020. The four-quarter moving average for PCB and MCM increased 5.3%.
  • SIP revenue rose 12.9% to $1,113 million compared to Q1 2020. The four-quarter SIP moving average grew 17.1%.
  • Services revenue increased 0.1% to $98.9 million compared to Q1 2020. The four-quarter Services moving average held steady with no growth.

Revenue by Region

  • The Americas, the largest reporting region by revenue, purchased $1,285.3 million of electronic system design products and services in Q1 2021, a 15% increase compared to Q1 2020. The four-quarter moving average for the Americas rose 13.5%.
  • Europe, Middle East, and Africa revenue increased 14% to $447.3 million compared to Q1 2020. The four-quarter moving average for EMEA grew 6.7%.
  • Japan revenue decreased 3.7% to $258.8 million compared to Q1 2020. The four-quarter moving average for Japan rose 4.3%.
  • Asia Pacific revenue increased 26.9% to $1,166.3 million compared to Q1 2020. The four-quarter moving average for APAC increased 23.8%.

About the EDMD Report

The ESD Alliance Electronic Design Market Data (formerly the Market Statistics Service) report presents EDA, SIP and services industry revenue data quarterly. Both public and private companies contribute data to the report available from SEMI. Each quarterly report is published approximately three months after quarter close. EDMD report data is segmented as follows:

  • Revenue by product category (CAE, IC Physical Design and Verification, Semiconductor IP, PCB/MCM Layout, and Services) including numerous detailed sub-categories
  • Revenue by geographic region (Americas, EMEA, Japan and APAC)
  • Total employment at participating companies

For information about SEMI market research reports, visit the SEMI Market Research Reports and Databases Catalog.


About the Electronic System Design Alliance

The Electronic System Design (ESD) Alliance, a SEMI Technology Community, is the central voice to communicate and promote the value of the semiconductor design ecosystem as a vital component of the global electronics industry. As an international association of companies providing goods and services throughout the semiconductor design ecosystem, it is a forum to address technical, marketing, economic and legislative issues affecting the entire industry. For more information about the ESD Alliance, visit http://esd-alliance.org.

About SEMI

SEMI® connects more than 2,400 member companies and 1.3 million professionals worldwide to advance the technology and business of electronics design and manufacturing. SEMI members are responsible for the innovations in materials, design, equipment, software, devices, and services that enable smarter, faster, more powerful, and more affordable electronic products. Electronic System Design Alliance (ESD Alliance), FlexTech, the Fab Owners Alliance (FOA) and the MEMS & Sensors Industry Group (MSIG) are SEMI Strategic Association Partners, defined communities within SEMI focused on specific technologies. Visit www.semi.org to learn more, contact one of our worldwide offices, and connect with SEMI on LinkedIn and Twitter.

The information supplied by the ESD Alliance is believed to be accurate and reliable, but the ESD Alliance assumes no responsibility for any errors that may appear in this document. All trademarks and registered trademarks are the property of their respective owners.


Press Contacts                                                                                 

Paul Cohen

ESD Alliance

A SEMI Technology Community

978-769-2106             
 

Jack Taylor

Siemens EDA

512-560-7143 

MEDIA ADVISORY

SEMI logo


Mid-Year Forecasts to Provide Global Chip Industry Insights

 Join the virtual Innovation for a Transforming World forum, July 13-14 – Presented by SEMI

11 briefings on microelectronics industry and Wall Street forecasts and global economic opportunities
 

Innovation for a Transforming World


WHAT: Annual mid-year semiconductor equipment, materials, fab capacity and economic forecasts will provide timely insights. Additionally, the forum will explore the COVID-19 pandemic’s acceleration of digital transformation and new solutions and business models for the microelectronics industry.

WHO: Featuring Dell, IBM, Deloitte, Bank of America Merrill Lynch, Altimeter and SEMI market analysts

  • Live Q&A to follow presentations

WHERE: Innovation for a Transforming World 2021 Virtual Forum

WHEN: July 13-14, 8:30am – 12:00pm PDT

HOW: Members of the media interested in attending should contact Scott Stevens

([email protected]) for a pass. Other attendees can sign up using general registration.


About SEMI

SEMI® connects more than 2,400 member companies and 1.3 million professionals worldwide to advance the technology and business of electronics design and manufacturing. SEMI members are responsible for the innovations in materials, design, equipment, software, devices, and services that enable smarter, faster, more powerful, and more affordable electronic products. Electronic System Design Alliance (ESD Alliance), FlexTech, the Fab Owners Alliance (FOA) and the MEMS & Sensors Industry Group (MSIG) are SEMI Strategic Technology Communities, defined communities within SEMI focused on specific technologies. Visit www.semi.org to learn more, contact one of our worldwide offices, and connect with SEMI on LinkedIn and Twitter.


Association Contact

Scott Stevens, Cardinal Communications for SEMI Americas

Phone: +1.512.288.4050

Email: [email protected]

글로벌 전자산업 공급망을 대표하는 산업 협회인 SEMI의 ‘팹 전망 보고서(World Fab Forecast)’에 따르면 급격하게 증가하는 통신, 컴퓨팅, 헬스케어, 온라인 서비스, 차량용 반도체 등의 수요를 충족하기위해 올해 말까지 19개의 신규 팹이 착공되며, 2022년에는 10개의 팹이 추가로 더 착공될 것으로 보인다.

SEMI의 CEO인 아짓 마노차(Ajit Manocha)는 "세계적인 칩 부족 문제를 해결하기위해 신설될 29개 팹의 장비 투자액은 향후 몇 년간 1,400억 달러를 넘어설 것으로 예상된다.”고 말했다. 이어 그는 "중장기적으로 전 세계 팹의 생산력 확대는 자율주행차, 인공지능, 고성능 컴퓨팅, 5G~6G 통신 등 새로운 애플리케이션에 따른 반도체 수요 증가에 부응할 것"이라고 덧붙였다.

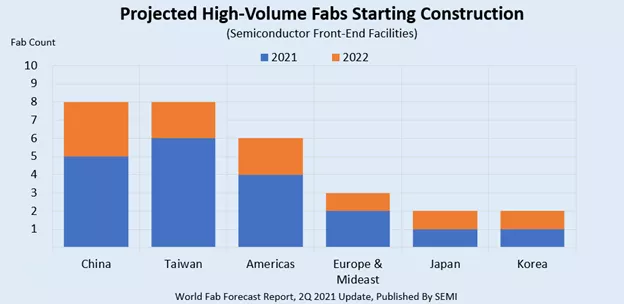
2022년까지 중국과 대만에 각각 8개, 북미 6개, 유럽 및 중동 3개, 일본과 한국에 각각 2개의 팹이(총 29개) 착공될 예정이다. 300mm 웨이퍼를 생산하는 팹은 2021년 15곳, 2022년에는 7곳이 착공에 들어간다. 나머지 7개의 팹은 100mm, 150mm, 200mm 웨이퍼를 생산하는 팹이다. 2022년까지 착공에 들어가는 팹의 전체 생산량은 월간 260만장 웨이퍼(200mm 웨이퍼 면적 기준)에 달할 것으로 전망된다.

그림1.jpg


2021년부터 2022년까지 착공되는 29개의 팹 중 15개는 파운드리 팹이며 200mm웨이퍼 기준 월간 생산량은 웨이퍼 3만에서 22만장 수준이다. 메모리 팹은 4개가 건설될 예정이며 200mm 웨이퍼 기준 월간 생산량은 10만에서 40만장 수준이다.

착공 후에 반도체 장비 설치까지는 보통 2년이 소요되기 때문에 올해 착공을 시작하는 팹 중 대다수는 2023년까지 반도체 장비 도입이 시작하지 않을 것으로 보인다. 하지만 일부 팹에는 이르면 내년 상반기부터 반도체 장비가 설치될 것으로 전망된다.

SEMI의 팹 전망 보고서에 따르면 내년에는 10개의 팹이 착공될 예정이지만 이 숫자는 칩 메이커의 결정 여부에 따라 더 증가할 수도 있다. 건설 예정인 팹의 생산량, 제품, 기술 등에 대한 자세한 내용은 SEMI 팹 전망 보고서를 통해 확인할 수 있다.


HSINCHU, Taiwan — June 29, 2021 — SEMICON Taiwan, the region’s premier gathering of the entire electronics manufacturing and design supply chain, has been postponed from September 8-10 to December 2021 or January 2022 in response to a resurgence of COVID-19 cases in Taiwan, SEMI Taiwan announced today. The new event date will be announced once it has been confirmed.   

SEMICON Taiwan logoThe rise in new COVID-19 cases has prompted the Taiwan government to raise the pandemic alert to Level 3, forcing the closure of facilities for large gatherings such as exhibitions and conferences. SEMICON Taiwan typically draws as many as 50,000 attendees from around the world. 

After establishing the new event date, SEMI Taiwan will fully comply with Taiwan Centers for Disease Control guidelines for preventing the spread of COVID-19 to ensure the safety of exhibitors and visitors at SEMICON Taiwan as their well-being remains SEMI’s top priority.


About SEMI

SEMI® connects more than 2,400 member companies and 1.3 million professionals worldwide to advance the technology and business of electronics design and manufacturing. SEMI members are responsible for the innovations in materials, design, equipment, software, devices, and services that enable smarter, faster, more powerful, and more affordable electronic products. Electronic System Design Alliance (ESD Alliance), FlexTech, the Fab Owners Alliance (FOA) and the MEMS & Sensors Industry Group (MSIG) are SEMI Strategic Technology Communities, defined communities within SEMI focused on specific technologies. Visit www.semi.org to learn more, contact one of our worldwide offices, and connect with SEMI Taiwan on Facebook and LinkedIn.


Association Contacts

Elma Fang /SEMI Taiwan

Phone: 886.3.560.1777 ext. 207

Email: [email protected]


Connie Lin /SEMI Taiwan

Phone: 886.3.560.1777 ext. 211

Email: [email protected]

MILPITAS, Calif. — June 22, 2021 — Semiconductor manufacturers worldwide will have started construction on 19 new high-volume fabs by the end of this year and break ground on another 10 in 2022 to meet accelerating demand for chips across a wide range of markets including communications, computing, healthcare, online services and automotive, SEMI highlighted today in its quarterly World Fab Forecast report.

SEMI logo“Equipment spending for these 29 fabs is expected to surpass $140 billion over the next few years as the industry pushes to address the global chip shortage,” said Ajit Manocha, SEMI president and CEO. “In the medium and longer term, the fab capacity expansion will help meet projected strong demand for semiconductors stemming from emerging applications such as autonomous vehicles, artificial intelligence, high-performance computing, and 5G to 6G communications.”

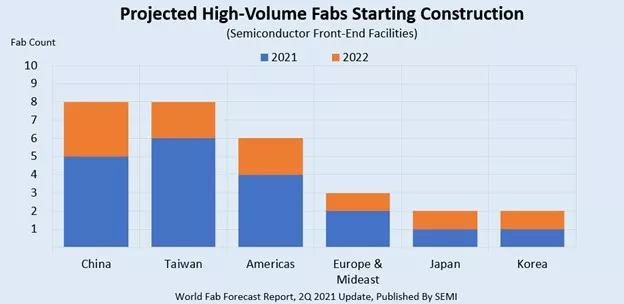
China and Taiwan will lead the way in the new fab construction starts with eight each, followed by the Americas with six, Europe/Mideast with three, Japan and Korea with two each (Figure 1). Fabs that produce 300mm wafers will account for most of the new facilities – 15 – in 2021 and again in 2022, when seven fabs will begin construction. The remaining seven fabs planned over the two-year period will be 100mm, 150mm and 200mm facilities. The 29 fabs could produce as many as 2.6 million wafers per month (in 200mm equivalents).


World Fab Forecast chart

Figure 1: Projected fab construction starts


Projected Fabs by Sector and Technology

Of the 29 fabs starting construction in 2021 and 2022, 15 are foundry facilities with capacities ranging from 30,000 to 220,000 wafers per month (200mm equivalents). The memory sector will begin construction on four fabs over the two-year span. Those facilities will boast higher capacities ranging from 100,000 to 400,000 wafers per month (200mm equivalents).

Of the semiconductor makers beginning construction of new fabs this year, many won’t start installing equipment until 2023 since it takes up to two years after ground is broken to reach that phase, though some could begin equipping as soon as the first half of next year.

While the World Fab Forecast shows 10 high-volume fabs starting construction next year, that number is likely to climb as chipmakers announce new facilities. The report tracks investments for fab construction and fab equipment, in addition to capacities, products and technologies from 2021 through 2022.

In addition to the 29 fabs expected to begin construction in 2021 and 2022, the World Fab Forecast report tracks eight low-probability projects that could start construction over the same period.


About SEMI

SEMI® connects more than 2,400 member companies and 1.3 million professionals worldwide to advance the technology and business of electronics design and manufacturing. SEMI members are responsible for the innovations in materials, design, equipment, software, devices, and services that enable smarter, faster, more powerful, and more affordable electronic products. Electronic System Design Alliance (ESD Alliance), FlexTech, the Fab Owners Alliance (FOA) and the MEMS & Sensors Industry Group (MSIG) are SEMI Strategic Technology Communities, defined communities within SEMI focused on specific technologies. Visit www.semi.org to learn more, contact one of our worldwide offices, and connect with SEMI on LinkedIn and Twitter.


Association Contacts

Michael Hall/SEMI
Phone: 1.408.943.7988
Email: [email protected]

Christian G. Dieseldorff/SEMI
Phone: 1.408.943.7940
Email: [email protected]

MILPITAS, Calif. — June 21, 2021 — North America-based semiconductor equipment manufacturers posted $3.59 billion in billings worldwide in May 2021 (three-month average basis), according to the May Equipment Market Data Subscription (EMDS) Billings Report published today by SEMI. The billings figure is 4.7% higher than final April 2021 billings of $3.43 billion and 53.1% higher than May 2020 billings of $2.34 billion.

SEMI logo“May billings of North America-based semiconductor equipment manufacturers continue their trajectory of remarkable growth,” said Ajit Manocha, SEMI president and CEO. “Semiconductor equipment investments continue to register record highs as the industry takes steps to address near-term manufacturing capacity constraints.”

The SEMI Billings report uses three-month moving averages of worldwide billings for North American-based semiconductor equipment manufacturers. Billings figures are in millions of U.S. dollars.


Billings
(3-mo. Avg.)

Year-Over-Year

December 2020

$2,680.8

7.6%

January 2021

$3,038.2

29.8%

February 2021

$3,143.1

32.4%

March 2021

$3,273.9

47.9%

April 2021 (final)

$3,428.9

50.3%

May 2021 (prelim)

$3,588.4

53.1%

Source: SEMI (www.semi.org), June 2021


SEMI publishes a monthly North American Billings report and issues the Worldwide Semiconductor Equipment Market Statistics (WWSEMS) report in collaboration with the Semiconductor Equipment Association of Japan (SEAJ). The WWSEMS report currently reports billings by 24 equipment segments and by seven end market regions. SEMI also has a long history of tracking semiconductor industry fab investments in detail on a company-by-company and fab-by-fab basis in its World Fab Forecast and SEMI FabView databases. These powerful tools provide access to spending forecasts, capacity ramp, technology transitions, and other information for over 1,000 fabs worldwide. For an overview of available SEMI market data, please visit www.semi.org/en/MarketInfo.

The data contained in this release were compiled by David Powell, Inc., an independent financial services firm, without audit, from data submitted directly by the participants. SEMI and David Powell, Inc. assume no responsibility for the accuracy of the underlying data.


About SEMI

SEMI® connects more than 2,400 member companies and 1.3 million professionals worldwide to advance the technology and business of electronics design and manufacturing. SEMI members are responsible for the innovations in materials, design, equipment, software, devices, and services that enable smarter, faster, more powerful, and more affordable electronic products. Electronic System Design Alliance (ESD Alliance), FlexTech, the Fab Owners Alliance (FOA) and the MEMS & Sensors Industry Group (MSIG) are SEMI Strategic Technology Communities, defined communities within SEMI focused on specific technologies. Visit www.semi.org to learn more, contact one of our worldwide offices, and connect with SEMI on LinkedIn and Twitter.
 

Association Contact

Michael Hall/SEMI
Phone: 1.408.943.7988
Email: 
[email protected]


Notes

Next SEMI Billings report is July 26, 2021 at 3:00pm Pacific.

For information on SEAJ Billings Express Report, visit www.seaj.or.jp.