downloadGroupGroupnoun_press release_995423_000000 copyGroupnoun_Feed_96767_000000Group 19noun_pictures_1817522_000000Member company iconResource item iconStore item iconGroup 19Group 19noun_Photo_2085192_000000 Copynoun_presentation_2096081_000000Group 19Group Copy 7noun_webinar_692730_000000Path
Skip to main content
Default Banner Image

Market Intelligence

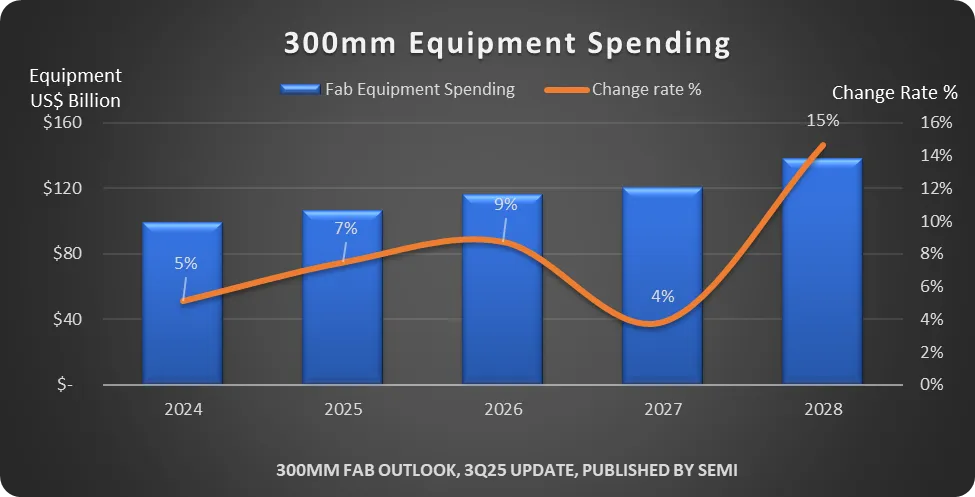
SEMICON West – PHOENIX — October 8, 2025 — Global 300mm fab equipment spending is expected to reach $374 billion from 2026 to 2028, SEMI reported today in its latest 300mm Fab Outlook. This robust investment reflects fab regionalization and surging AI chip demand for data centers and edge devices, while underscoring the growing commitment to semiconductor self-sufficiency across key regions through localized industrial ecosystems and supply chain restructuring.

SEMIWorldwide 300mm fab equipment spending is expected to surpass $100 billion for the first time in 2025, growing 7% to $107 billion. The report projects investment will increase 9% to $116 billion in 2026, 4% to $120 billion in 2027, and 15% to $138 billion in 2028.

“The semiconductor industry is entering a pivotal era of transformation, driven by unprecedented demand for AI-enabled technologies and a renewed focus on regional self-sufficiency,” said Ajit Manocha, President and CEO of SEMI. “Strategic global investments and collaboration are driving robust, advanced supply chains and faster deployment of next-generation semiconductor manufacturing technologies. The global expansion of 300mm fabs will enable progress in data centers, edge devices, and the digital economy.”


Segment Growth

The Logic & Micro segment is projected to lead equipment expansion with $175 billion in total investments from 2026 to 2028. Foundries are expected to be the primary drivers of this growth, fueled by sub-2nm capacity build-outs. Key enablers include advanced technologies such as gate-all-around (GAA) architecture and backside power delivery, which are essential to enhancing chip performance and power efficiency for increasingly demanding AI workloads. More advanced 1.4nm process technology is expected to enter volume production by 2028-2029. Additionally, AI performance improvements are anticipated to drive massive growth in edge-devices including automotive electronics, IoT applications, and robotics. Beyond advanced processes, demand across all nodes and various electronics devices is expected to surge significantly, fueling mature process equipment investment.

The Memory segment is projected to rank second with $136 billion in spending over the three-year period, marking the beginning of a new growth cycle for the segment. DRAM-related equipment investment is expected to exceed $79 billion from 2026 to 2028, with 3D NAND investment reaching $56 billion over the same period. AI training and inference have driven comprehensive demand increases across various types of memory. AI training requires greater data transmission bandwidth and extremely low latency, significantly boosting high bandwidth memory (HBM) demand. Moreover, model inference generates higher quality and more diverse AI digital content, creating substantial demand for end storage capacity and driving 3D NAND Flash requirements. This robust demand has sustained elevated levels of supply chain investment in memory over the medium to long term, helping to mitigate potential downturns from traditional memory cycle fluctuations.

Analog-related segments’ anticipated investment is projected to exceed $41 billion over the next three years.

Including Compound semiconductors, the power-related segment is expected to invest $27 billion from 2026 to 2028.

Regional Growth

China is expected to continue to lead in 300mm equipment spending with $94 billion in projected investments from 2026 to 2028, sustained by national self-sufficiency policies. 

Korea is projected to rank second in global 300mm equipment spending over the three-year period with $86 billion invested, supporting industries worldwide in generative AI demand. 

Taiwan is expected to invest $75 billion in 300mm equipment over the three years, ranking third. Investment will concentrate primarily on 2nm and sub-2nm capacity to maintain dominance in advanced foundry capacity and technology leadership.

The report projects Americas to invest $60 billion from 2026 to 2028, rising to fourth position. U.S. suppliers are expanding advanced process capacity to meet surging AI application demands while catalyzing domestic industrial and investment upgrades to maintain global technology development leadership.

Japan, Europe & Middle East, and Southeast Asia are projected to invest $32 billion, $14 billion, and $12 billion, respectively, over the three-year period. Policy incentives aimed at alleviating critical semiconductor supply concerns are expected to increase equipment investment by more than 60% in these regions by 2028 compared to 2024.

Part of the SEMI Fab Forecast database, the SEMI 300mm Fab Outlook lists 391 facilities and lines globally. The report reflects 173 updates and nine new fabs/lines projects since its last publication in January 2025.

For more information on the report or to subscribe to SEMI market data, visit SEMI Market Data or contact the SEMI Market Intelligence Team (MIT) at [email protected].

About SEMI

SEMI® is the global industry association connecting over 3,000 member companies and 1.5 million professionals worldwide across the semiconductor and electronics design and manufacturing supply chain. We accelerate member collaboration on solutions to top industry challenges through Advocacy, Workforce Development, Sustainability, Supply Chain Management and other programs. Our SEMICON® expositions and events, technology communities, standards and market intelligence help advance our members’ business growth and innovations in design, devices, equipment, materials, services and software, enabling smarter, faster, more secure electronics. Visit www.semi.org, contact a regional office, and connect with SEMI on LinkedIn and X to learn more.


MILPITAS, Calif. — October 6, 2025 — Electronic System Design (ESD) industry revenue increased 8.6% to $5,089.4 million in the second quarter of 2025 from the $4,685.5 million registered in the second quarter of 2024, the ESD Alliance, a SEMI Technology Community, announced today in its latest Electronic Design Market Data (EDMD) report. The four-quarter moving average rose 10.4%, based on a comparison of the most recent four quarters to the prior four.

SEMI ESDA“The electronic design automation (EDA) industry continues to report strong year-over-year revenue growth in Q2 2025,” said Walden C. Rhines, Executive Sponsor of the SEMI Electronic Design Market Data report. “Product categories including Computer-Aided Engineering (CAE), Printed Circuit Board and Multi-Chip Module, Semiconductor IP, and Services reported increases, with CAE and Services showing double digit gains. Geographic regions including Americas, EMEA, and APAC reported growth in Q2, even hitting double digits in Americas and EMEA.”

The companies tracked in the EDMD report employed 72,529 people globally in Q2 2025, a 14.8% increase over the Q2 2024 headcount of 63,188 and up 12.6% compared to Q1 2025. 

The quarterly EDMD report contains detailed revenue information within the following category and geographic breakdowns. 

Revenue by Product and Application Category – Year-Over-Year Change

  • Computer-Aided Engineering (CAE) revenue increased 17.2% to $1,929 million. The four-quarter CAE moving average increased 13.5%.
  • IC Physical Design and Verification revenue decreased 9.9% to $701.9 million. The four-quarter moving average for the category decreased 3.1%.
  • Printed Circuit Board and Multi-Chip Module (PCB and MCM) revenue rose 7.8% to $430.5 million. The four-quarter moving average for PCB and MCM rose 8.8%.
  • Semiconductor Intellectual Property (SIP) revenue increased 8.7% to $1,826.7 million. The four-quarter SIP moving average rose 13.2%.
  • Services revenue increased 11.9% to $201.2 million. The four-quarter Services moving average rose 21.3%.

Revenue by Region – Year-Over-Year Change

  • The Americas, the largest reporting region by revenue, procured $2,282.4 million of electronic system design products and services in Q2 2025, a 12.2% increase. The four-quarter moving average for the Americas rose 14.1%.
  • Europe, Middle East, and Africa(EMEA) procured $650.9 million of electronic system design products and services in Q2 2025, an 11.4% increase. The four-quarter moving average for EMEA grew 10.7%.
  • Japan’s procurement of electronic system design products and services decreased 9.2% to $277.4 million. The four-quarter moving average for Japan increased 4.4%.
  • Asia Pacific (APAC) procured $1,878.7 million of electronic system design products and services in Q2 2025, a 6.7% increase. The four-quarter moving average for APAC grew 7.2%. 

About the EDMD Report

The ESD Alliance Electronic Design Market Data (formerly the Market Statistics Service) report presents Electronic Design Automation (EDA), SIP and Services industry revenue data quarterly. Both public and private companies contribute data to the report available from SEMI. Each quarterly report is published approximately three months after quarter close. EDMD report data is segmented as follows: 

  • Revenue by product category (CAE, IC Physical Design and Verification, SIP, PCB/MCM Layout, and Services) including numerous detailed sub-categories
  • Revenue by geographic region (Americas, EMEA, Japan and APAC)
  • Total employment at participating companies

For information about SEMI market research reports, visit the SEMI Market Research Reports and Databases Catalog.

About the Electronic System Design Alliance

The Electronic System Design (ESD) Alliance, a SEMI Technology Community, is the central voice to communicate and promote the value of the semiconductor design ecosystem as a vital component of the global electronics industry. As an international association of companies providing goods and services throughout the semiconductor design ecosystem, it is a forum to address technical, marketing, economic and legislative issues affecting the entire industry. For more information about the ESD Alliance, visit http://esd-alliance.org.

Follow the ESD Alliance

About SEMI

SEMI® is the global industry association connecting over 3,000 member companies and 1.5 million professionals worldwide across the semiconductor and electronics design and manufacturing supply chain. We accelerate member collaboration on solutions to top industry challenges through Advocacy, Workforce Development, Sustainability, Supply Chain Management and other programs. Our SEMICON® expositions and events, technology communities, standards and market intelligence help advance our members’ business growth and innovations in design, devices, equipment, materials, services and software, enabling smarter, faster, more secure electronics. Visit www.semi.org, contact a regional office, and connect with SEMI on LinkedIn and X to learn more.

The information supplied by the ESD Alliance is believed to be accurate and reliable, but the ESD Alliance assumes no responsibility for any errors that may appear in this document. All trademarks and registered trademarks are the property of their respective owners.


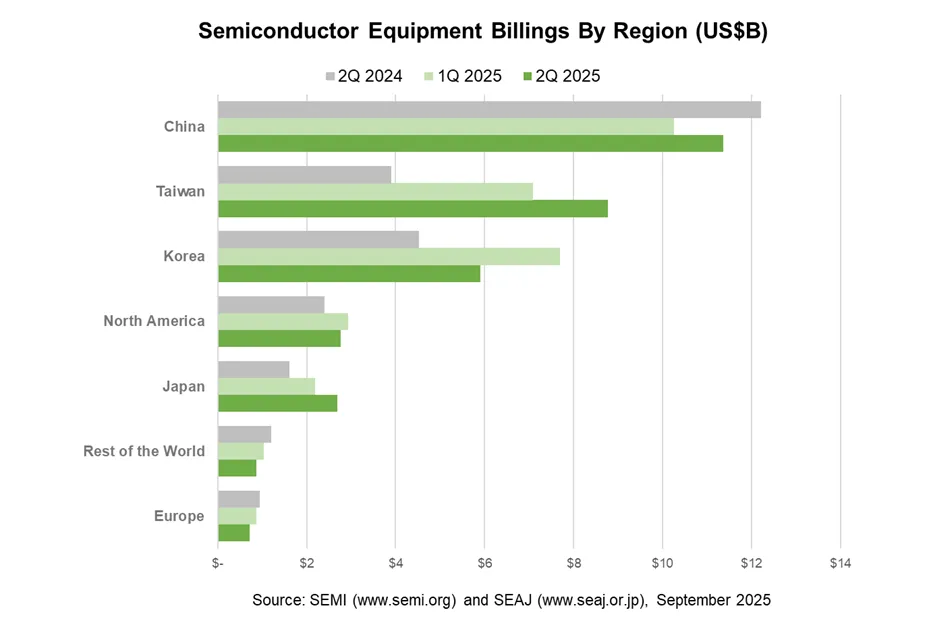
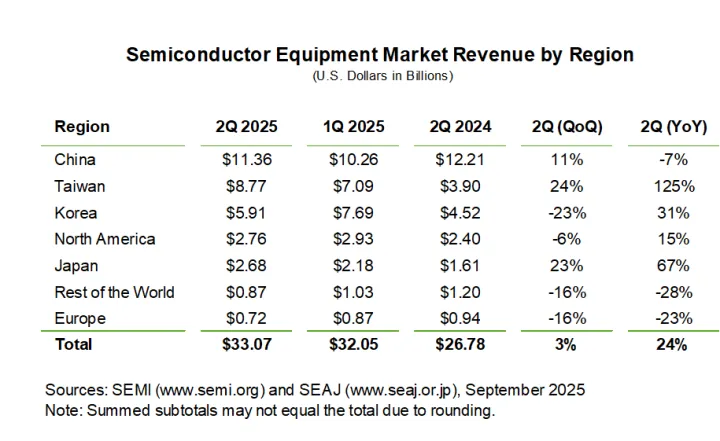
MILPITAS, Calif. – September 4, 2025 – SEMI, the industry association serving the global semiconductor and electronics design and manufacturing supply chain, today announced in its Worldwide Semiconductor Equipment Market Statistics (WWSEMS) Report that global semiconductor equipment billings increased 24% year-over-year to US$33.07 billion in the second quarter of 2025. Second quarter 2025 billings registered a 3% quarter-over-quarter expansion supported by the leading-edge logic, advanced high bandwidth memory (HBM) related DRAM applications, as well as increase in shipments to Asia.

SEMI“The global semiconductor equipment market has followed record billings of $117 billion in 2024 with a strong first half of 2025, registering more than $65 billion in revenue,” said Ajit Manocha, SEMI President and CEO. “Chipmakers continue to invest in production capacity to support advanced logic and memory innovation powering the AI wave, as well as key projects to bolster regional supply chain resilience.”

Compiled from data submitted by members of SEMI and the Semiconductor Equipment Association of Japan (SEAJ), the WWSEMS Report is a summary of the monthly billings figures for the global semiconductor equipment industry. 

Following are quarterly billings data in billions of U.S. dollars, with quarter-over-quarter and year-over-year changes by region:

The SEMI Equipment Market Data Subscription (EMDS) provides comprehensive market data for the global semiconductor equipment market. The subscription includes three reports:

  • Monthly SEMI Billings Report, a perspective on equipment market trends
  • Monthly WWSEMS, a detailed report of semiconductor equipment billings for seven regions and 24 market segments
  • SEMI Semiconductor Equipment Forecast, an outlook for the semiconductor equipment market

Download a sample of the EMDS report.

For more information about the report or to subscribe, please contact the SEMI Market Intelligence Team at [email protected]. More details are also available on the SEMI Market Data webpage.  

About SEMI

SEMI® is the global industry association connecting over 3,000 member companies and 1.5 million professionals worldwide across the semiconductor and electronics design and manufacturing supply chain. We accelerate member collaboration on solutions to top industry challenges through Advocacy, Workforce Development, Sustainability, Supply Chain Management and other programs. Our SEMICON® expositions and events, technology communities, standards and market intelligence help advance our members’ business growth and innovations in design, devices, equipment, materials, services and software, enabling smarter, faster, more secure electronics. Visit www.semi.org, contact a regional office, and connect with SEMI on LinkedIn and X to learn more.

Association Contacts

Sherrie Gutierrez/SEMI
Phone: 1.831.889.3800 
Email: [email protected]

Stephanie Quinn/Kiterocket (Media Inquiries)
Phone: 1.480.316.8370
Email: [email protected]  

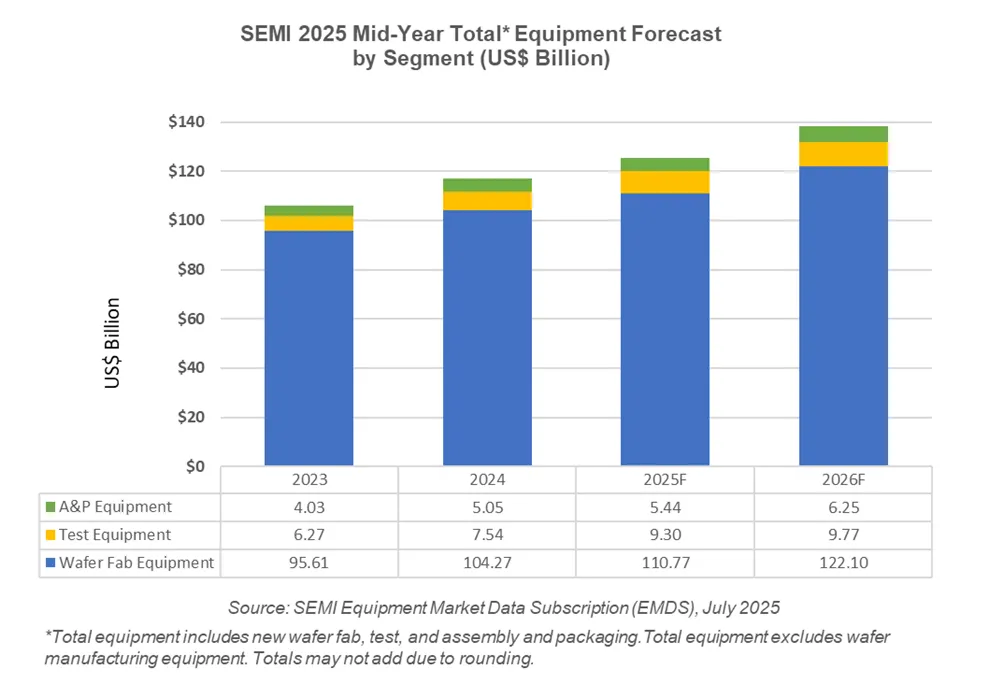
MILPITAS, Calif. — July 22, 2025 — SEMI today announced that global sales of total semiconductor manufacturing equipment by original equipment manufacturers (OEMs) are forecast to set a new industry record of $125.5 billion in 2025, a 7.4% year-on-year increase, according to its Mid-Year Total Semiconductor Equipment Forecast – OEM Perspective. Semiconductor manufacturing equipment growth is expected to continue in 2026, with sales projected to reach a new high of $138.1 billion, driven by leading-edge logic, memory and technology transitions.

SEMI“Following strong growth in 2024, global semiconductor manufacturing equipment sales are forecast to expand again this year and set a new record in 2026,” said Ajit Manocha, SEMI president and CEO. “While the semiconductor industry is closely monitoring macroeconomic uncertainty, AI-fueled demand for chip innovations is driving investments in capacity expansions and leading-edge production.”

Semiconductor Equipment Sales by Segment 

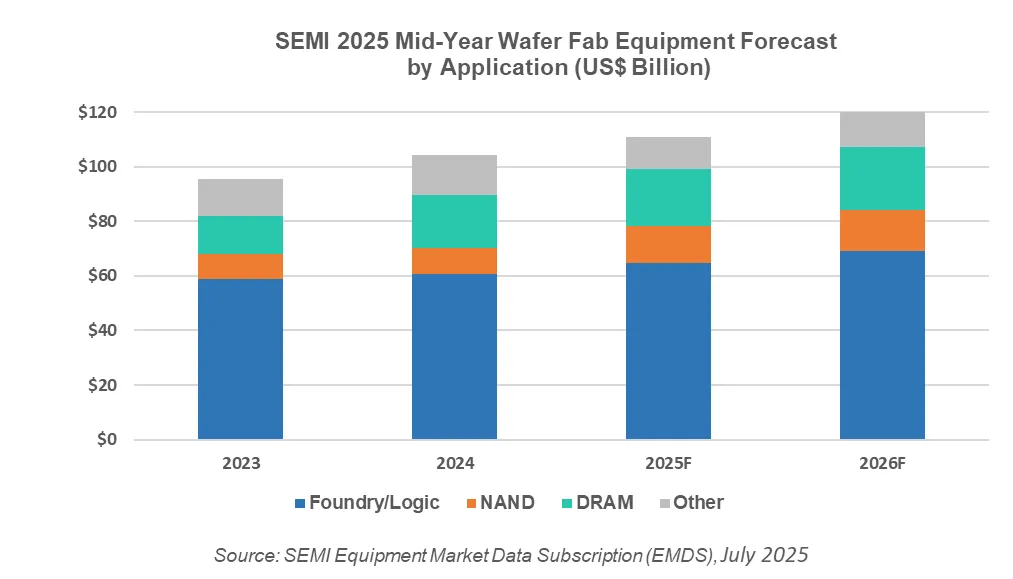
After registering a record $104.3 billion in sales last year, the Wafer Fab Equipment (WFE) segment, which includes wafer processing, fab facilities and mask/reticle equipment, is projected to increase 6.2% to $110.8 billion in 2025. This upward revision from SEMI’s 2024 Year-End Equipment Forecast of $107.6 billion is largely driven by increased sales to foundry and memory applications. Looking ahead to 2026, WFE segment sales are projected to expand 10.2%, reaching $122.1 billion. The growth is attributed to capacity expansions in leading-edge logic and memory to support AI applications, as well as ongoing process technology migrations across major segments. 

The back-end equipment segment is anticipated to continue its strong recovery that began in 2024. Following that year’s robust 20.3% year-on-year growth, sales of semiconductor test equipment are projected to rise another 23.2% in 2025 to a new record of $9.3 billion. Assembly and packaging equipment sales grew 25.4% in 2024 and are forecast to increase 7.7% to $5.4 billion in 2025. Back-end equipment segment expansion is expected to continue in 2026, with test equipment sales rising 5.0% and assembly and packaging sales increasing 15.0%, marking three consecutive years of growth. The expansion is driven by significant increases in the complexity of device architectures and the robust performance requirements for AI and high-bandwidth memory (HBM) semiconductors. However, growth in this segment is partially offset by continued weakness in the automotive, industrial and consumer end markets. 

Mid-Year Total*EF


WFE Sales by Application

WFE sales for foundry and logic applications are expected to show stable growth of 6.7% year-over-year to $64.8 billion in 2025, driven by robust demand for advanced nodes. In 2026, the segment is forecast to grow another 6.6%, reaching $69.0 billion. The growth will be supported by increased capacity expansion purchases and rising demand for leading-edge technologies as the industry progresses toward high-volume manufacturing at the 2nm gate-all-around (GAA) node.

Memory-related capital expenditures are projected to see an increase in 2025 and to demonstrate continued growth in 2026. NAND equipment sales continue to recover from a sharp contraction of 2023. After registering a modest 4.1% increase in 2024, the NAND equipment market is expected to see 42.5% expansion to $13.7 billion in 2025 and 9.7% to $15.0 billion in 2026, driven by advancements in 3D NAND stacking and capacity expansion. Meanwhile, DRAM equipment sales, which surged 40.2% in 2024 to $19.5 billion, are projected to grow at 6.4% and 12.1% in 2025 and 2026, respectively, supporting investments in HBM for AI deployment. 

Mid-Year WFEF


Semiconductor Equipment Sales by Region

China, Taiwan and Korea are expected to remain the top three destinations for equipment spending through 2026. China continues to lead all regions over the forecast period, though sales in the region are expected to decline from 2024 record investments of $49.5 billion. All other regions except Europe are expected to see significant increases in equipment spending starting in 2025. However, heightened trade policy risks may impact the pace of growth across regions. 

The SEMI forecast is based on collective input from top equipment suppliers, the SEMI Worldwide Semiconductor Equipment Market Statistics (WWSEMS) data collection program, and the industry-recognized SEMI World Fab Forecast database. 

About SEMI Market Data

The Equipment Market Data Subscription (EMDS) from SEMI provides comprehensive market data for the global semiconductor equipment market. A subscription includes three reports: 

  • Monthly SEMI North American Billings Report, an early perspective of equipment market trends
  • Monthly Worldwide Semiconductor Equipment Market Statistics (WWSEMS), a detailed report of semiconductor equipment billings for seven regions and more than 22 market segments
  • Bi-annual Total Semiconductor Equipment Forecast – OEM Perspective, an outlook for the semiconductor equipment market

For more information on the report or to subscribe, please contact the SEMI Market Intelligence Team at [email protected]. Details on SEMI market data are available at SEMI Market Data.  

About SEMI

SEMI® is the global industry association connecting over 3,000 member companies and 1.5 million professionals worldwide across the semiconductor and electronics design and manufacturing supply chain. We accelerate member collaboration on solutions to top industry challenges through Advocacy, Workforce Development, Sustainability, Supply Chain Management and other programs. Our SEMICON® expositions and events, technology communities, standards and market intelligence help advance our members’ business growth and innovations in design, devices, equipment, materials, services and software, enabling smarter, faster, more secure electronics. Visit www.semi.org, contact a regional office, and connect with SEMI on LinkedIn and X to learn more.

Association Contact

Sherrie Gutierrez/SEMI
Phone: 1.831.889.3800 
Email: [email protected]

MILPITAS, Calif. — July 15, 2025 — Electronic System Design (ESD) industry revenue increased 12.8% to $5,098.3 million in the first quarter of 2025 from the $4,521.6 million registered in the first quarter of 2024, the ESD Alliance, a SEMI Technology Community, announced today in its latest Electronic Design Market Data (EDMD) report. The four-quarter moving average rose 12.6%, based on a comparison of the most recent four quarters to the prior four.

SEMI & ESDA“The electronic design automation (EDA) industry once again reported strong year-over-year revenue growth in Q1 2025,” said Walden C. Rhines, Executive Sponsor of the SEMI Electronic Design Market Data report. “Product Categories CAE, IC Physical Design and Verification, and PCB & MCM reported single digit increases, with Semiconductor IP and Services reporting significant double-digit increases. All geographic regions reported growth in Q1, with Americas, EMEA, and Japan reporting double digit growth.”

The companies tracked in the EDMD report employed 64,403 people globally in Q1 2025, a 4.5% increase over the Q1 2024 headcount of 61,653 and up 2.5% compared to Q4 2024.

The quarterly EDMD report contains detailed revenue information within the following category and geographic breakdowns. 

Revenue by Product and Application Category – Year-Over-Year Change

  • Computer-Aided Engineering (CAE) revenue increased 7.8% to $1,747.6 million. The four-quarter CAE moving average increased 11.4%.
  • IC Physical Design and Verification revenue decreased 9.9% to $693.5 million. The four-quarter moving average for the category increased 2.3%.
  • Printed Circuit Board and Multi-Chip Module (PCB and MCM) revenue rose 5.5% to $399.8 million. The four-quarter moving average for PCB and MCM rose 8.9%.
  • Semiconductor Intellectual Property (SIP) revenue increased 29.6% to $2,044.8 million. The four-quarter SIP moving average rose 18.7%.
  • Services revenue jumped 22.3% to $212.6 million. The four-quarter Services moving average rose 26.0%.

Revenue by Region – Year-Over-Year Change

  • The Americas, the largest reporting region by revenue, procured $2,208.3 million of electronic system design products and services in Q1 2025, a 14.0% increase. The four-quarter moving average for the Americas rose 17.0%.
  • Europe, Middle East, and Africa(EMEA) procured $651.5 million of electronic system design products and services in Q1 2025, a 12.5% increase. The four-quarter moving average for EMEA grew 11.4%.
  • Japan’s procurement of electronic system design products and services grew 11.9% to $314.2 million. The four-quarter moving average for Japan increased 12.1%.
  • Asia Pacific (APAC) procured $1,924.2 million of electronic system design products and services in Q1 2025, an 11.6% increase. The four-quarter moving average for APAC grew 8.2%. 

About the EDMD Report

The ESD Alliance Electronic Design Market Data (formerly the Market Statistics Service) report presents Electronic Design Automation (EDA), SIP and Services industry revenue data quarterly. Both public and private companies contribute data to the report available from SEMI. Each quarterly report is published approximately three months after quarter close. EDMD report data is segmented as follows: 

  • Revenue by product category (CAE, IC Physical Design and Verification, SIP, PCB/MCM Layout, and Services) including numerous detailed sub-categories
  • Revenue by geographic region (Americas, EMEA, Japan and APAC)
  • Total employment at participating companies

For information about SEMI market research reports, visit the SEMI Market Research Reports and Databases Catalog.

About the Electronic System Design Alliance

The Electronic System Design (ESD) Alliance, a SEMI Technology Community, is the central voice to communicate and promote the value of the semiconductor design ecosystem as a vital component of the global electronics industry. As an international association of companies providing goods and services throughout the semiconductor design ecosystem, it is a forum to address technical, marketing, economic and legislative issues affecting the entire industry. For more information about the ESD Alliance, visit http://esd-alliance.org.

About SEMI

SEMI® is the global industry association connecting over 3,000 member companies and 1.5 million professionals worldwide across the semiconductor and electronics design and manufacturing supply chain. We accelerate member collaboration on solutions to top industry challenges through Advocacy, Workforce Development, Sustainability, Supply Chain Management and other programs. Our SEMICON® expositions and events, technology communities, standards and market intelligence help advance our members’ business growth and innovations in design, devices, equipment, materials, services and software, enabling smarter, faster, more secure electronics. Visit www.semi.org, contact a regional office, and connect with SEMI on LinkedIn and X to learn more.

The information supplied by the ESD Alliance is believed to be accurate and reliable, but the ESD Alliance assumes no responsibility for any errors that may appear in this document. All trademarks and registered trademarks are the property of their respective owners.

Association Contacts                                                                                    

Paul Cohen
Phone: 978-769-2106 
Email: [email protected]

Jack Taylor
Phone: 512-560-7143 
Email: [email protected]

MILPITAS, Calif. – July 7, 2025 – SEMI, the global industry association advancing the electronics manufacturing and design supply chain, today launched the new Wafer Fab Materials Quarterly report in collaboration with Linx Consulting. SEMI recently acquired select assets from Linx Consulting, including market reports and conferences, to amplify its market intelligence capabilities in semiconductor materials and specialty chemicals.

SEMI & LINXThe Wafer Fab Materials Quarterly is a comprehensive report delivering in-depth analysis and forecasts for global wafer fab materials markets. Published quarterly in January, April, July, and October, it equips industry professionals with actionable insights into economic trends, material usage, sales performance, and capacity forecasts. This collaborative effort harnesses SEMI’s extensive industry data and Linx Consulting’s analytical and forecasting expertise to support strategic and operational decision-making.

“The launch of this new quarterly materials report complements our market intelligence portfolio, offering deeper insights into the increasingly important materials market,” said Clark Tseng, Senior Director of Market Intelligence at SEMI. “By delivering detailed, forward-looking data every quarter, the Wafer Fab Materials Quarterly helps industry leaders to quickly respond to market shifts and make more informed decisions than annual reports allow.”

Report highlights:

  • Comprehensive Market Coverage: Segmented forecasts for silicon wafers, photoresists, gases, deposition materials, wet chemicals, and CMP materials, with breakdowns by product segment and end-use application.
  • Quarterly Performance Tracking: Exclusive sales data for leading suppliers and semiconductor companies, enabling benchmarking and market share analysis.
  • Capacity and Materials Intensity: Capacity forecasts by product type, region, and wafer size, plus cost-per-wafer insights by process node.
  • Macroeconomic Context: Global indicators like GDP, industrial production, and CPI to frame semiconductor market trends.
  • Industry Overview: Analysis of semiconductor sales, CapEx, silicon MSI, inventory, and utilization rates.

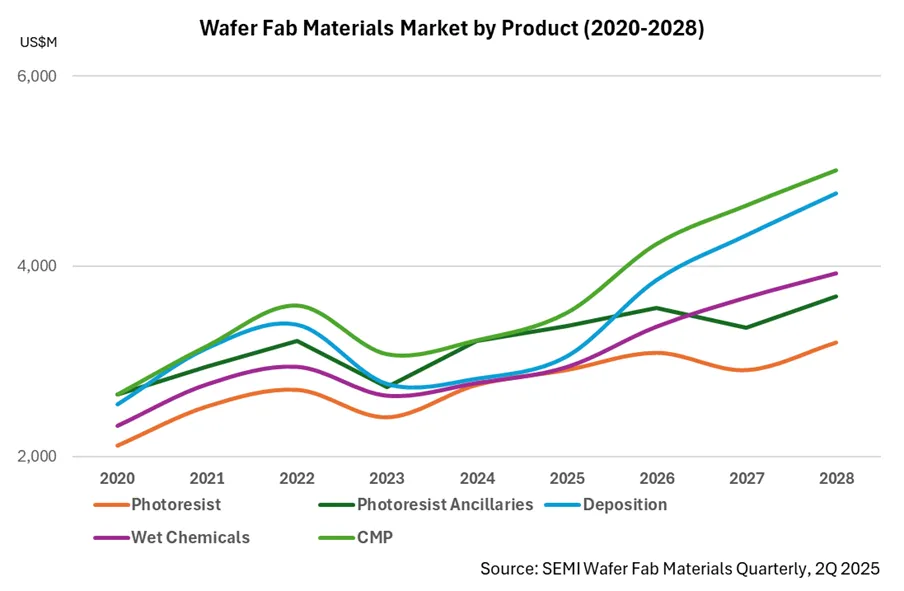
The inaugural 2Q 2025 edition reveals a dynamic transformation in wafer fab materials markets, with the industry demonstrating remarkable resilience through its recovery trajectory. Following the 2023 materials downturn, the sector achieved robust growth in 2024, led by photoresist materials surging 14% after an 11% contraction the previous year. 

The report highlights how technology evolution is driving unprecedented demand for advanced materials, with advanced photoresist now representing over 80% of market revenue and projected to reach 84% by 2028. Chemical mechanical planarization (CMP) materials emerge as the standout growth segment, benefiting significantly from increasing device complexity and layer counts in next-generation semiconductors. With advanced process nodes (≤7nm) capacity growing at a 20% CAGR through 2028, there is increasing demand for innovative material solutions that support atomic-scale precision manufacturing. 

WFM

Delivered in Microsoft Excel and PowerPoint formats, the SEMI Wafer Fab Materials Quarterly report offers historical data from 2020 and forecasts through 2028, allowing users to manipulate data, integrate it into business models, and perform custom analyses. The report supports strategic planning, operational optimization, and technology innovation across the supply chain.

For details about SEMI reports on other semiconductor sectors, visit SEMI Market Data or contact the SEMI Market Intelligence team at [email protected].

About SEMI

SEMI® is the global industry association connecting over 3,000 member companies and 1.5 million professionals worldwide across the semiconductor and electronics design and manufacturing supply chain. We accelerate member collaboration on solutions to top industry challenges through Advocacy, Workforce Development, Sustainability, Supply Chain Management and other programs. Our SEMICON® expositions and events, technology communities, standards and market intelligence help advance our members’ business growth and innovations in design, devices, equipment, materials, services and software, enabling smarter, faster, more secure electronics. Visit www.semi.org, contact a regional office, and connect with SEMI on LinkedIn and X to learn more.

About Linx Consulting

Linx Consulting is a leading provider of market intelligence and consulting services to the semiconductor and electronics industries. Known for its in-depth market reports and high-caliber conferences, Linx Consulting has been a trusted partner to industry leaders for over two decades.

Association Contact

Sherrie Gutierrez/SEMI
Phone: 1.831.889.3800 
Email: [email protected]

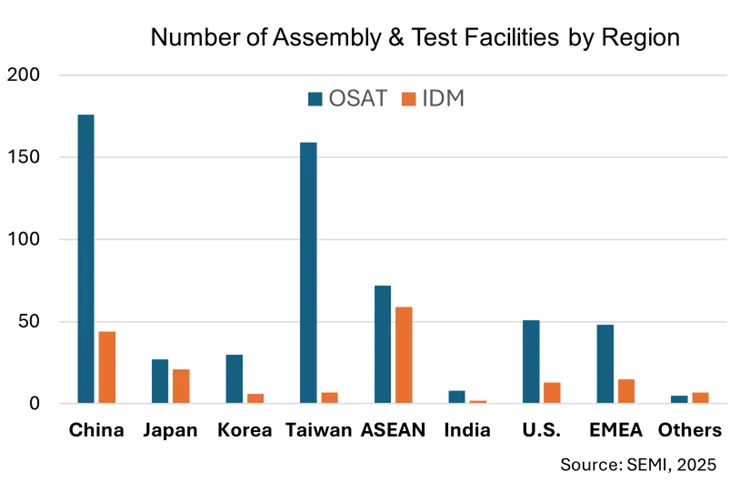
MILPITAS, Calif. – July 1, 2025 – SEMI and TechSearch International today announced the release of the 2025 edition of the Worldwide Semiconductor Assembly & Test Facility Database, the industry’s most comprehensive resource tracking global assembly and test sites operated by integrated device manufacturers (IDMs) and outsourced semiconductor assembly and test providers (OSATs).

The Worldwide Assembly & Test Facility Database remains an indispensable tool for mapping the global semiconductor supply chain, identifying new capacity, and tracking technology adoption across regions. The 2025 report’s expanded content and improved structure further strengthen its value for industry stakeholders seeking actionable intelligence in a rapidly evolving market.

“The 2025 edition of the Worldwide Assembly & Test Facility Database reflects the dynamic growth and increasing complexity of the global semiconductor supply chain,” said Clark Tseng, Senior Director of Market Intelligence at SEMI. “By expanding our coverage and incorporating new data features, we are providing industry stakeholders with a deeper understanding of global packaging and testing capabilities, technology adoption, and regional trends as the market continues to evolve.”

The 2025 edition delivers several significant updates and enhancements:

  • Expanded Coverage: The database now includes 750 facilities worldwide, an increase of 70 new sites compared to the 2024 edition, reflecting ongoing industry investment and expansion.
  • Enhanced Data Structure: New columns have been added to improve data granularity and usability:
    • Each facility is now assigned a unique Facility ID for easier reference and tracking.
    • Additional columns detail device types, including memories, logic/analog ICs, power devices, RF/MEMS chips, and CMOS image sensors, enabling users to identify specialized manufacturing and test capabilities at a glance.
    • The startup year for some facilities is now included, providing insights into the operational history and maturity of each site.
  • Regular Facility Updates: In addition to these new features, the database continues to offer up-to-date information on facility status, ownership, location, plant type, production capabilities, and certification status, supporting strategic decision-making for manufacturers, suppliers, and analysts.
Number of assembly & test facilities

For details about SEMI reports on other semiconductor sectors, visit SEMI Market Data or contact the SEMI Market Intelligence team at [email protected].

About SEMI

SEMI® is the global industry association connecting over 3,000 member companies and 1.5 million professionals worldwide across the semiconductor and electronics design and manufacturing supply chain. We accelerate member collaboration on solutions to top industry challenges through Advocacy, Workforce Development, Sustainability, Supply Chain Management and other programs. Our SEMICON® expositions and events, technology communities, standards and market intelligence help advance our members’ business growth and innovations in design, devices, equipment, materials, services and software, enabling smarter, faster, more secure electronics. Visit www.semi.org, contact a regional office, and connect with SEMI on LinkedIn and X to learn more.

Association Contact

Sherrie Gutierrez/SEMI
Phone: 1.831.889.3800 
Email: [email protected]


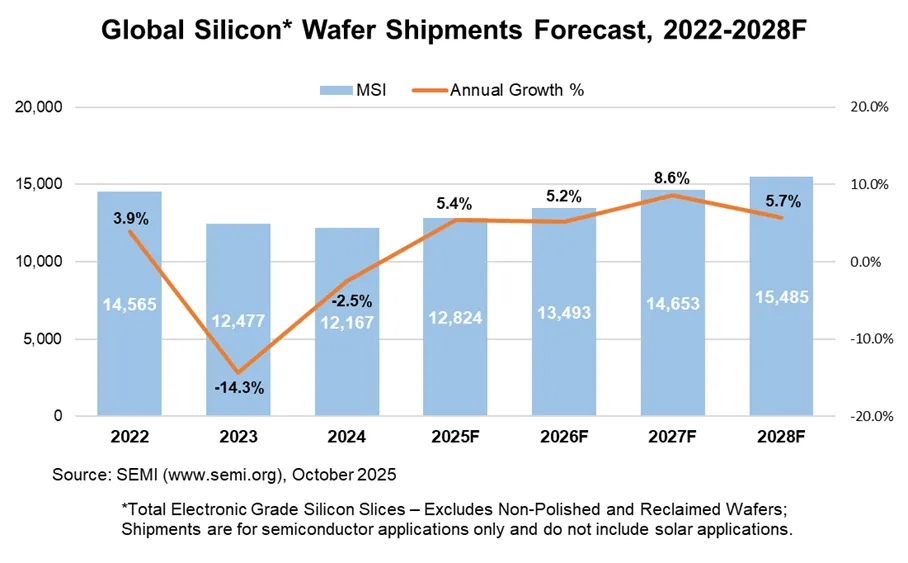
MILPITAS, Calif. — October 21, 2024 ─ Global shipments of silicon wafers are projected to decline 2% in 2024 to 12,174 million square inches (MSI) with a strong rebound of 10% delayed until 2025 to reach 13,328 MSI as wafer demand continues to recover from the downcycle, SEMI reported today in its annual silicon shipment forecast. 


Strong silicon wafer shipment growth is expected to continue through 2027 to meet increasing demand related to AI and advanced processing, driving improved fab utilization rate for global semiconductor production capacity. Moreover, new applications in advanced packaging and high-bandwidth memory (HBM) production, which require additional wafers, are contributing to the rising need for silicon wafers. Such applications include temporary or permanent carrier wafers, interposers, device separation into chiplets, and memory/logic array separation. 
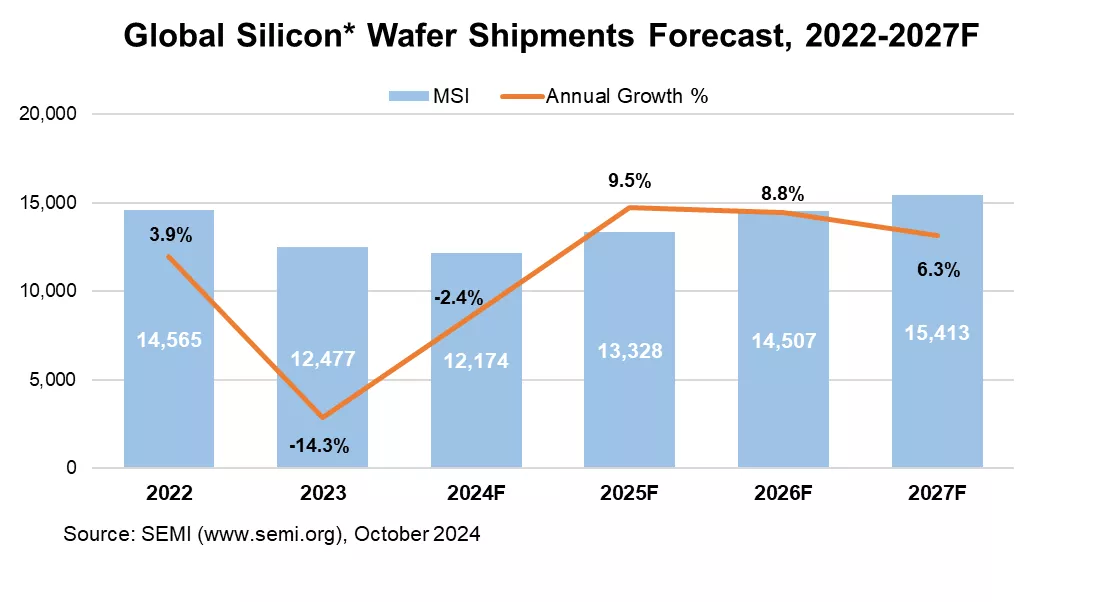
 

SEMI Global Silicon Wafer Shipments Forecast

*Total electronic grade silicon slices – excludes non-polished and reclaimed wafers; shipments are for semiconductor applications only and do not include solar applications


Silicon wafers are the fundamental building material for the majority of semiconductors, which are vital components of all electronic devices. The highly engineered thin disks, produced in diameters of up to 300 mm, serve as the substrate material on which most semiconductor devices, or chips, are fabricated.

All data cited in this release include polished silicon wafers and epitaxial silicon wafers shipped by wafer manufacturers to end users. The data does not include non-polished or reclaimed wafers.


The SEMI annual silicon shipment forecast is developed based on input from the members of the Silicon Manufacturers Group (SMG). The SMG is a sub-committee of the SEMI Electronic Materials Group (EMG) and is open to SEMI members involved in manufacturing polycrystalline silicon, monocrystalline silicon or silicon wafers (e.g., as cut, polished, epi). The SMG facilitates collective efforts on issues related to the silicon industry including the development of market information and statistics about the silicon and semiconductor industries.


For more information, please visit SEMI Worldwide Silicon Wafer Shipment StatisticsSEMI Market Data or contact [email protected].


About SEMI

SEMI® is the global industry association connecting over 3,000 member companies and 1.5 million professionals worldwide across the semiconductor and electronics design and manufacturing supply chain. We accelerate member collaboration on solutions to top industry challenges through Advocacy, Workforce Development, Sustainability, Supply Chain Management and other programs. Our SEMICON® expositions and events, technology communities, standards and market intelligence help advance our members’ business growth and innovations in design, devices, equipment, materials, services and software, enabling smarter, faster, more secure electronics. Visit www.semi.org, contact a regional office, and connect with SEMI on LinkedIn and X to learn more.


Association Contact
Samer Bahou/SEMI
Phone: 1.408.943.7870
Email: [email protected]