downloadGroupGroupnoun_press release_995423_000000 copyGroupnoun_Feed_96767_000000Group 19noun_pictures_1817522_000000Member company iconResource item iconStore item iconGroup 19Group 19noun_Photo_2085192_000000 Copynoun_presentation_2096081_000000Group 19Group Copy 7noun_webinar_692730_000000Path
Skip to main content
Default Banner Image

China

This year, SEMI ISS covered it all – from a high-level semiconductor market and global geopolitical overview down to the neuro morphic and quantum level. Here are key takeaways from the Day 1 keynote and Economic Trends and Market Perspectives presentations.In the opening keynote, Anne Kelleher from Intel pointed to the huge growth of data, with fabs collecting more than 5 billion sensor data points each day. The challenge, Kelleher noted, is to turn massive amounts of data into valuable information. Moore’s law is not dead. New models of computing benefit still from Moore’s law and advances in Si/CMOS technologies for conventional, deep learning, neuro morphic and quantum computing.With customers expecting continual improvements in applications, the question is whether the chip industry is moving fast enough to meet these expectations, Kelleher said. A broad supply chain, equipment and materials innovations, and attracting the “best of the best” college graduates to fuel innovation is key, she said.In the economic trends session, Nicholas Burns (ambassador ret.) from Harvard University pointed out that we will see a major shift in power. The U.S. will remain the major world power over the next 10 years, but we will see a major shift in power in the next coming decades as the gap with countries like China, Russia and India continues to narrow.Duncan Meldrum from Hilltop Economics said that we are passing the peak growth of economic cycle. He warns that a more likely outlook is that a global growth recession is developing. Although semiconductor MSI growth will see a noticeable slowdown in 2019 and 2020, the semiconductor industry is still healthy over the longer term.Bob Johnson from Gartner sees demand shifting from consumer to commercial applications with higher ROIs and budgets. AI, IoT and 5D are the major enablers. He sees structural changes in the semiconductor industry especially for memory but also for Moore’s law with increasing costs and fewer players.The DRAM markets shows volatility and NAND market may be negative in 2019 but non-memory are expected to accelerate mainly because of increasing content and some price hikes.Overall Gartner expects good long-term growth with a CAGR (2017 to 2022) of 5.1%, outpacing 2011 to 2016 CAGR of 2.6%. After a strong 2018 with 13.4% revenue, he forecasts a slower 2019 with 2.6% growth followed by a 8% growth in 2020 and negative growth rate in 2021.Andrea Lati of VLSI went “Back to fundamentals” in his presentation about the industry. VLSI sees a downside bias due to slowing global economy, tariffs, and trade wars. Future drivers are data economy, cloud, AI and automotive.As memory leads the 2019 slowdown, analog, power, logic and other sectors remain in positive territory. VLSI lowered its semiconductor equipment forecast for 2018 from 20% (Jan. 2018) to 14% (Dec. 2018) but increased its sales outlook from 8% to 15% in 2018. VLSI expects revenue to slow into the first half of 2019 but increase to over 4% in the second half of the year, resulting in total 2019 drop of 2.7%. Semiconductor equipment sales are expected to drop from 14% in 2018 to -10% in 2019.Michael Corbett of Linz Consulting, covering wafer fab materials in the years of 3D scaling, sees these as good times for the industry. His outlook for wafer fab materials is bullish based on strong MSI and because wafer fab materials suppliers are getting bigger because of M As.In the Market Perspective session, Sujeet Chand of Rockwell Automation pointed out that as more and more data is generated, the problem is how to get value of all the data collected. There is a need to create the right architecture for machine learning and AI and big data is increasingly being replaced by contextual/structured data. He expects Industry 4.0 to drive foundries to become smaller, more flexible and more productive.In the Technology and Manufacturing session, Aki Sekiguchi of TEL addressed process challenges in the age of co-optimization. The semiconductor industry continues to expand, driven by massive growth of interconnected devices, with heavy demand for processing power and storage. He expects an exponential increase of data from about 40ZB in 2018 to 50ZB in 2020 to 163 ZB in 2026.Major technologies such as DRAM, 3D NAND and logic are dealing with scaling challenges. The density of DRAM (Mb/chip) is plateauing according to 2015 to 2020 trend data, with DRAM is in need of EUV. Memory capacity demand is leading to increasing layers and higher aspect ratios that is concern for 3D NAND and mainly for plasma etch. With Logic already implementing 3D structures, it appears to be in a solid position. Buddy Nicoson of Micron talked about his 50 years in the industry and looked ahead to the next 50. The anchors – quality, cost, scale and speed – won’t change. It has been a great journey so far with unprecedented opportunities and challenges ahead of us. We are getting into a convergence (specialization, integration) and solution-based phase. We will see some inflection points in the coming years, with the best yet to come.Christian G. Dieseldorff is senior principal analyst in the Industry Research and Analysis group at SEMI in Milpitas, California.
Read More
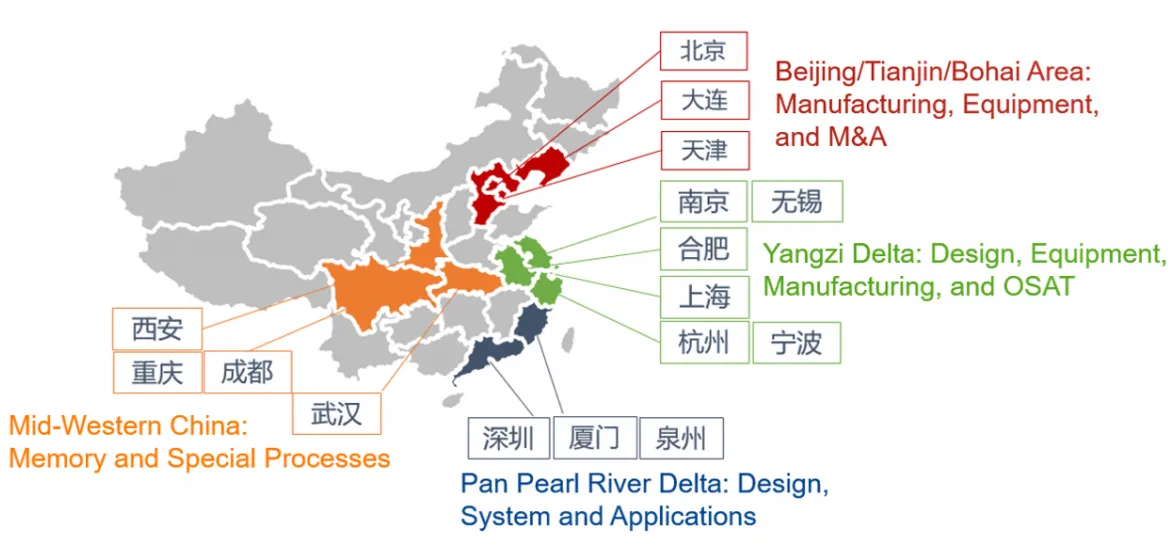
IC design has emerged as the largest semiconductor sector in China, with 2017 revenues of $31.9 billion generated by about 1,380 companies. At the same time, China’s fabless segment has risen to third in global rankings with about one-tenth of worldwide sales.Most of China’s fabless segment produces the logic chips that are key to defense, telecommunications, finance and other industries important to the region’s national security interests and its independence from U.S. and other international suppliers. Investment in fabless logic continues to be the top priority in China’s Phase 2 investment. In mobile, China made meaningful progress through HiSilicon and Spreadtrum, both fabless design houses.In 2017, HiSilicon and UNISOC (formerly Spreadtrum), China’s two largest domestic IC design companies, were ranked in the global top 10 of fabless companies, though most Chinese IC design companies are small, with revenues under $1 million. Working with domestic smartphone makers, both companies have carved out a strong presence in logic and, in particular, the communications and application processors that power data centers and Internet of Things (IoT).Despite their rapid rise, China’s AI accelerators and cryptocurrency ASIC suppliers have yet to appear in China’s top 10. However, we expect their aggressive roadmaps and early adoption of leading-edge process technologies to propel them into the top 10 in the near future. As illustrated in the figure below, an examination of the competitiveness of China’s semiconductor segments reveals that the close proximity of China’s fabless companies to the region’s electronic systems makers plays to their advantage, though access to IP and leading-edge process technologies is a barrier to their growth in the near term. A key barrier to China’s foundries is their limited ability to develop leading-edge process technologies and strategic relationships with top international fabless companies. Most leading international fabless companies rely on customer-owned tooling (COT) and design tools for design. As the approach takes time to develop, it will not support China’s aggressive goal and timeline to independently meet domestic IC demand. Instead, China has been disciplined in executing its strategy to acquire valuable IP and leading-edge technologies by aggressively partnering with international fabless design leaders and pursuing deals with market leaders and laggards. The initial entry point for Chinese fabless companies was the low-margin consumer applications dominated by Chinese suppliers, giving them considerable control over demand. In addition, Chinese companies have aggressively hired top talent from abroad and grown the skills of its engineering workforce to sustain innovation. China will likely free itself from its reliance on non-Chinese developed manufacturing process technology and EDA design tools.China’s semiconductor design growth, concentrated in the Pearl River Delta (see figure below), is fueled by national and local investment programs. SEMI August 2018 The Pearl River Delta, which includes Xiamen, Quanzhou and Shenzhen, is establishing itself as China’s IC design, system and application hub. Domestic and international companies are eligible for investment provided they are established or investing in one of the four regionshat are home to various sectors of the electronics and semiconductor supply chain. Access to large investment funds, coupled with China’s infrastructure build-out, is a strong supporting force to drive the growth of top-tier domestic fabless companies. For its part, the Phase 2 of China’s National Investment Fund targets investments of RMB 150 - 200 billion ($23 billion - $30 billion) in IC design. The growing domestic consumer base and infrastructure investment will drive opportunities for China’s fabless companies over the next decade.To learn more about the latest development on China IC Industry, and get a sample of the China IC Ecosystem Report, visit http://www.semi.org/en/china-ic-ecosystem-report.China IC Ecosystem Report covers the rise of China’s IC industry, national and local government policies, public and private funding, and their implications for China's IC supply chain. The report also compares key domestic companies and their international peers segment by segment.Eugenia Liu is a senior product marketing manager at SEMI. Shanshan Du is chief analyst and program director at SEMI China.
Read More
Part 1 of this article discussed the Memory Inventory Cycle Index and compared it with memory device sales and memory fab equipment investments. This article, the second of the two-part series, illustrates how the Memory Inventory Cycle Index starts to weaken before memory sales of the top three memory suppliers decline. It also shows how the Memory Inventory Cycle Index peaked in the fourth quarter of last year along with YoY growth rates for both memory sales and memory fab equipment investments.In addition to the weakening signaled by the Memory Inventory Cycle Index, memory suppliers are facing headwinds in the form of tariffs as mentioned in Micron’s most recent earnings call. The U.S.-China trade dispute could reduce Micron’s profitability; China granted a preliminary injunction to prevent Micron’s Chinese subsidiary from manufacturing and selling in China this July. However, it is very difficult to quantify the risk the tariffs pose to the future of the memory market.On the other hand, the YoY growth rate of semiconductor sales according to the World Semiconductor Trade Statistics is closely tied to China’s manufacturing sector as shown by the Purchasing Managers Index (PMI) New export orders and Orders in hand sub-indexes. Figure 3 shows that as the growth rate of new exports and order backlog slows, the YoY growth rate of semiconductor sales will be adversely impacted. As the largest consumer of semiconductors in the world, China will bear the brunt of the slowing market. Figure 3. Memory Inventory Cycle Index China manufacturing sector PMI’s sub-indices * RemarksChina PMI’s sub-indices are on the basis of the data published by NBS (National Bureau of Satistics of China). Also those data were calculated based on 12MMA (12-month moving average) to minimize seasonal fluctuation. The YoY growth rate of the 3-month moving average of semiconductor sales in China alone, China and Asia Pacific, and all regions showed additional declines in July (Figure 4). Monitoring the Orders in hand and New export orders sub-indices for China and China’s semiconductor consumption and WSTS sales revenue in China can help track the risk of trade disputes. Figure 4. YoY growth rate of semiconductor sales revenue in China and Asia Pacific * Remarks1) Regions as defined by WSTS’ Bluebook.2) Sales revenue were calculated based on 3MMA (3-month moving average value). A review of the relationship between the Memory Inventory Cycle Index, semiconductor sales, and memory fab equipment investment growth rates suggests we have passed the peak in the current cycle. However, bear in mind that the Work In Process (WIP) to Finished-goods inventory ratio has sharply increased since 2017 as shown in Figure 5. The increase in WIP inventory could be attributed to the increasing technical challenges associated with 3D NAND stacking and DRAM scaling. As a result, the proportion of finished-goods inventory in total inventory remained low until the second quarter of 2018, possibly implying that memory demand remained healthy in spite of the contraction modeled by the Memory Inventory Cycle Index. Figure 5. The proportion of finished-goods inventory in the total inventories * Remarks 1) All inventories data from 3 companies’ financial reports were calculated based on 4-quarter moving average.2) Total Inventory accounts for the sum of Finished-Goods, WIP, and Raw materials inventory.3) Company data complied by SEMI. The Memory Inventory Cycle Index has entered a period of contraction, which is supported by Micron’s weak guidance for its fiscal first quarter of 2019 (September to November). The outlook for memory sales and memory fab equipment investments reported by WSTS and SEMI, respectively, also suggests that a market correction is underway. While the low proportion of finished-goods inventory does not threaten the market yet, it should remind industry observers to view high WIP inventories with caution. Unlike past inventory cycles, the high inventory levels could burden the memory market in the absence of sustainable demand.Sungho Yoon is a senior market research analyst in Industry Research and Statistics at SEMI. SEMI China IC Ecosystem ReportLearn more about 30 new fab construction projects underway or planned in China in the newly released SEMI China IC Ecosystem Report. The research report is a comprehensive update and analysis of China's IC manufacturing ecosystem with charts, graphs, tables and maps.
Read More
Micron, one of the top three memory semiconductor companies, reported solid results for the fourth quarter of fiscal 2018 (June to August) to extend a multi-quarter string of strong growth. However, the company’s mediocre guidance for the current quarter has raised concerns that memory demand will start to slow.To shed light on this super memory cycle, which began in the second half of 2016, this article examines correlations among the top three memory suppliers’ sales revenue, quarterly inventory levels, World Semiconductor Trade Statistics (WSTS) market data, and memory fab equipment investments reported by SEMI.The Memory Inventory Cycle Index, which is based on financial data reported by Samsung, SK Hynix and Micron, is the difference between the year-over-year growth rates of sales (or shipments) and inventories. The index explains business cycle fluctuations such as expansions and contractions, trending up in expansions and declining in contractions. Figure 1 shows both historical Micron sales (blue dotted line) and the quarterly Memory Inventory Cycle Index (black solid line). To minimize seasonal fluctuations, both were calculated based on a four-quarter moving average of sales and inventories. Figure 1. Memory Inventory Cycle Index Compared to Memory Sales* Remarks1) Memory Inventory Cycle Index = YoY growth rate of memory sales revenues - YoY growth rate of memory total inventoris value on a four quarters moving average.2) Calculated memory sales and inventoris are based on Samsung, SK Hynix, and Micron public announcements.3) South Korea Won were converted to US$ based on the quaterly average value released by FRED.4) Companies’ sales data were calculated based on 4-quarter moving average.5) Company data complied by SEMI. As shown in Figure 1, the Memory Inventory Cycle Index has been declining since peaking in the fourth quarter of 2017, mirroring the previous two contractions – in 2010 and 2014 – in which memory sales slowed or stagnated after four quarters of the index decline. Accordingly, if this relationship holds between the Memory Inventory Cycle Index and sales, Micron’s sales will slow in the coming quarters and is consistent with Micron’s guidance for the current quarter. Moreover, the index suggests that the sum of three companies’ sales (the solid red line) will exhibit a similar trend of decreased growth in the coming quarters, which will impact the annual growth rate of global memory sales.WSTS recently increased its 2018 forecast for memory sales to 30.5%, up from 26.5% projected in June of this year. However, the 3-month moving average of memory sales shows that memory sales already increased by 48% YoY in the first half of the year, which means growth is expected to be lower in the second half of the year. Other signs pointing to a weaker end to the year include front-end equipment investments by the top three memory suppliers. SEMI is modeling an annual increase of only one percent for the year for these suppliers, with spending down 23% in the second half relative to the first half of the year.Figure 2 shows the historical trend of the Memory Inventory Cycle Index, the YoY growth rate of memory sales, and YoY memory fab equipment investments. The Memory Inventory Cycle Index increased faster than memory sales and fab equipment investments in the past two cycles. In the most recent memory cycle, these three indexes are moving in tandem, each peaking in the fourth quarter of 2017. Figure 2. Memory Inventory Cycle Index, Memory Sales and Memory Fab Equipment Investments* Remarks1) Both sales and memory fab equipment investments data were calculated based on 4-quarter moving average to minimize seasonal fluctuation.2) All data are from SEMI, except memory sales (WSTS) While overall memory sales continue to be strong this year, memory ASPs have shown signs of weakening right after the inventory index peak. NAND flash ASPs have been trending downward since the first quarter of 2018. With the recent inventory correction and short-term CPU shortage, DRAM ASPs are expected to soften in the fourth quarter of 2018. The looming memory market slowdown has memory makers adjusting their capacity expansion plans for the rest of this year. Some new capacity additions, especially for DRAM, have been pushed out to 2019. The memory inventory cycle index has to some extent foretold the slowdown of the memory market. In the second and final part of this article, we will discuss the correlation between the Memory Inventory Cycle Index and China’s semiconductor sales and Purchasing Managers Index. We will also look at the increasing level of memory inventory in the past few quarters and its composition including Work-in-Progress and Finished goods. Clark Tseng is director and Sungho Yoon is senior market research analyst in Industry Research and Statistics at SEMI. SEMI World Fab ForecastFor the latest worldwide memory fabs forecast including company details, please see the SEMI World Fab Forecast. The report includes quarter-to-quarter fab data from planning to production for both DRAM and NAND Flash companies.
Read More
Outsourced Semiconductor Assembly and Test (OSAT) service providers experienced strong growth in 2017, but will this growth continue? In the last few years, OSAT growth has been driven by shipments for packages found in smartphones, but this market is slowing. What will replace it? Growth in power devices is strong and electronic content in vehicles is increasing. Will OSATs participate in this growth? Many OSATs have plants dedicated to automotive package assembly and will see continued growth. Growing demand for connectivity everywhere, called IoT, is generating large amounts of data, creating the need for more servers and datacenters. The adoption of Artificial Intelligence (AI) across a broad range of applications is driving demand for high-performance packages, but will this assembly take place at the OSATs or foundries? In the third and fourth quarters of 2017, growth in cryptocurrency provided unanticipated revenue for a number of OSATs. Given that the most well-known crypto mining companies and the biggest mining pools are all based in China, several OSATs, including major Taiwanese and Chinese service providers, experienced revenue growth in 2017 directly attributed to the assembly of ASICs in flip chip scale packages (FC-CSPs) and GPUs in flip chip ball grid arrays (FC-BGAs) for the cryptocurrency market. However, the first and second quarter of this year has seen decreased demand for GPUs and ASICs for this application. The assembly of packages for cryptocurrency slowed considerably in the first half of the year and therefore can’t be counted on to add as much to the revenue base as in the previous year. Going into the latter half of the year, the demand for Crypto ASICs is expected to pick up as new generation of 7nm chips will drive new investment and replacement cycle while crypto-mining GPU will see a further decline. Three of the top 10 OSATs, Jiangsu Changjiang Electronics Technology (JCET), Tianshui Huatian Technology (Huatian), and Tongfu Microelectronics (TFME), are based in China. China’s share of the top 10 OSATs’ revenue increased from slightly less than 23 percent in 2016 to more than 25 percent in 2017, and this trend is expected to continue. Crypto-related packaging and test business has certainly contributed a big portion of the share gain. Major OSATs such as TFME and Tianshui Huatian plan expansion in their plants and they expect to fill this added capacity in a broad range of packages. Huatian’s new Nanjing plant will include assembly for memory packages. TFME plans to set up a plant in Xiamen, Fujian Province to provide bumping, wafer level packaging, and system-in-packaging (SiP) services. Tracking the capabilities of OSATs is increasingly important. SEMI and TechSearch International have introduced a new Worldwide OSAT Manufacturing Site Database that provides listings of OSAT facility locations and package and test options in each factory. This database indicates the specific packages offered at each location. Finding plants that offer automotive qualified assembly is also possible with the database. Companies that offer bumping and wafer level packaging are identified. Over 120 companies and 300 facilities are tracked in this database covering both OSAT packaging and test facilities. For additional information about this informative database, please visit https://discover.semi.org/osat-database-registration.html E. Jan Vardaman is president of TechSearch International, Inc., and Clark Tseng is director of Industry Research and Statistics at SEMI.
Read More
SEMI Releases latest update to World Fab Forecast with adjusted semiconductor revenue consensus for second-half 2018 and 2019 Global semiconductor revenue in 2018 is now expected to reach $473.8 billion and clock a growth rate of 15 percent, a significant upward revision from the 7.5 percent expansion (to $442.9 billion) forecast at the start of the year by six research and investment forecasts tracked by SEMI Industry Research and Statistics (SEMI IR S). Data center growth will remain robust in the coming quarters, fueling demand for memory devices. In addition, cloud computing will continue to spur strong CPU, GPU, networking, ASIC, and DRAM and NAND demand through 2019, driving a consensus 3.63 percent year-to-year growth to reach the semiconductor revenue of $491 billion in 2019. Fab equipment spending (new and used) for 2018 is expected to increase by 14 percent to a record high of $63 billion, according to the last data from the SEMI World Fab Forecast, published by SEMI IR S. For 2019, fab equipment spending (new and used) is expected to increase 8 percent to another record of just under $68 billion. Memory continues to be the biggest swing factor in fab spending in 2018 and is expected to lead growth into 2020. 3D NAND will see the most capacity added in 2018 and 2019 with growth of 41 percent in 2018 and 27 percent in 2019, according to the SEMI World Fab Forecast. DRAM investment will see even stronger growth in 2018 and 2019 driven by new capacity addition as well as the continued technology shrink towards 1y/1z nm. For the first half of 2018, global spending for semiconductor fab equipment continues its growth momentum from 2017. Though we expect some softness in the second half of 2018, the outlook for 2019 remains robust with a fourth consecutive year of growth – the first such run since the 1990s. This prolonged growth cycle has been propelled by memory and will be extended by significant investment in China in 2019. Although a potential slowdown in 2020 is a concern, the overall outlook for semiconductor demand remains solid due to broad-based growth trends in data center, artificial intelligence (AI)/machine learning (ML), automotive, and industrial segments. Following are other SEMI forecasts for fab spending. Installed Capacity 3D NAND will see the most capacity added in both 2018 and 2019 with growth of 41 percent in 2018 and 27 percent in 2019. Foundry capacity growth is steady at 3 percent in 2018 and 6 percent in 2019, driven by both leading-edge and trailing-edge capacity buildup. 200mm fab capacity will increase 4 percent in 2018 and 3 percent in 2019, fueled by demand for MCU, sensors, PMIC, MOSFET and Driver IC. New Facilities / Construction Spending In 2018, there are 72 construction projects with investments totaling $15 billion, a year-over-year increase of 23 percent. Construction spending will reach all-time highs with China continuing its lead at US$7 billion in 2018, shattering its own record of $6.3 billion investment in 2017. Most construction spending in 2018 will be for Memory (just under $9 billion), primarily for 3D NAND followed by DRAM. Foundry will log second place in construction spending at just under $5 billion. Fab Equipment Spending Fab equipment spending (new and used) for 2018 is expected to jump 14 percent to a record high of US$63 billion, flat from the forecast issued in June 2018. Equipment spending (new and used) for 2019 is expected to increase 8 percent to another record of just under US$68 billion, a downward adjustment from +9 percent published in June 2018. We believe equipment spending will remain healthy, driven by solid, broad-based demand and predictable technology investments on top of constructive SEMICAP equipment fundamentals. Activity Report The August report features 1,265 records including about 300 Opto- and LED-related facilities. We have made 223 changes related to 216 fabs/lines. The modifications include the addition of new records, changes to existing records, the deletion of records since the February 2018 World Fab Forecast report. We are tracking 103 future facilities/lines with various probabilities that will start volume production in 2018 or later. Download a sample report Not a subscriber? Please review SEMI fab databases listed below. Our databases deliver the latest forecast and a complete analysis of front-end fabs and foundries worldwide. They are ideal resources to empower your market research. Eugenia Liu is a Senior Product Marketing Manager at SEMI.
Read More
The China IC Ecosystem Report, a comprehensive report for the IC manufacturing supply chain, reveals that front-end fab capacity in China will grow to account for 16 percent of the world's semiconductor fab capacity this year, a share that will increase to 20 percent by the end of 2020. With the rapid growth, China will top the rest of the world in fab investment in 2020 with more than $20 billion in spending, driven by memory and foundry projects funded by both multinational and domestic companies, according to the new report released today by SEMI.The report also shows that IC Design remained the largest semiconductor sector in China for the second year in a row with $31.9 billion in revenue in 2017, widening its lead over the long-dominant IC Packaging and Test sector. The ascent of China’s IC Design sector comes as the region’s equipment market is expected to claim the top spot in 2020 for the first time on the strength of the continuing development of its domestic manufacturing capability. China’s maturing domestic fab sector is also benefiting domestic equipment and materials suppliers. Both groups continue to see gains in their product offerings and capabilities, particularly in silicon wafer production. The China IC Ecosystem Report is produced by SEMI, the global industry association and provider of independent electronics market research.The more than RMB140 billion (US$21.5 billion) accumulated by the National IC Fund, a critical component of the 2014 National Guideline to address China’s semiconductor trade deficit, has spurred rapid gains throughout the region’s IC supply chain. Semiconductors are China’s largest import by revenue. Phase 2 of funding aims to raise another RMB150-200 billion ($23.0-$30.0 billion).Encouraged by the National Guideline and favorable policies, skilled overseas talent is returning to China, triggering an explosion of domestic IC Design start-ups that are benefiting from access to investment and favorable policies, the report shows.Other highlights from The China IC Ecosystem Report include: Currently 25 new fab construction projects are underway or planned in China. 17 - 300 mm fabs are being tracked as part of this investment and expansion activity. Foundry, DRAM and 3D NAND are the leading segments for fab investment and new capacity in China. China’s IC Packaging and Test industry is also moving up the value chain by enhancing its technology offerings through mergers and acquisitions and building advanced capabilities to entice international integrated device manufacturers. China’s IC materials market, currently dominated by Packaging materials, became the second largest regional market for materials in 2016, a position it solidified in 2017. China’s materials market is expected to grow at a 10 percent CAGR from 2015 to 2019, driven primarily by the region’s new fab capacity ramp in the coming years. Fab capacity will expand at a 14 percent CAGR during that period. The China IC Ecosystem Report covers the latest semiconductor supply chain and market developments including the rise of China’s IC industry, national and local government policies, public and private funding, and their implications for China's IC supply chain. The report also compares key domestic companies and their international peers segment by segment. To learn more and get a sample of the report, visit http://www.semi.org/en/china-ic-ecosystem-report.Eugenia is a Senior Product Marketing Manager at SEMI.
Read More
Powerful winds of change are re-shaping the semiconductor industry as it flexes and re-positions to power a new wave of growth on the back of emerging applications. Today, the industry is thriving, with growth expected to continue through 2019 even as Moore’s Law – the trusty doubling of transistors roughly every two years – begins to pump the brakes. Product mix and production technology are shifting as the dominant smartphone and PC markets, having seen their growth peaks, start to give way to large markets with relatively low semiconductor penetration, such as automotive.What’s more, new potentially ubiquitous technologies and platforms such as AI, blockchain and smart manufacturing are redefining market dynamics and the semiconductor ecosystem that underlies them.Troublingly, the most significant threats to the continued growth of the semiconductor industry are not of its own making. Macroeconomic trends and trade policy disputes loom.These were some of the key takeaways from the SEMI Market Symposium kicking off SEMICON West in San Francisco this week. Following is a deeper look.Semiconductor MarketThe consensus view, reflected in forecasts presented by Clark Tseng of SEMI and Bob Johnson of Gartner, is that the semiconductor industry could top $500 billion in 2019 after reaching $400 billion in 2017. According to Gartner, smartphones and PCs will continue to account for large parts of the market, but will be displaced as major drivers of market growth by the emergence of industrial, automotive and, to a lesser extent, storage, from 2017 to 2022. Johnson noted that while communications and data processing applications drive logic device demand, average sales prices (ASPs) are a bigger contributor to revenue growth than unit growth.Leading-edge processors are a big part of the ASP picture, with equipment costs increasing ~20 percent per node. One challenge is that as Moore’s Law loses steam, leading logic producers are increasingly going their own way with new production technology. The volatile DRAM market – now in a “super cycle,” according to Tseng, and expected to peak in 2019 – has been stoking memory market growth.Initially, supply shortages fueled memory price increases as three of the four leading memory makers invested in flash rather than DRAM capacity. However, memory prices have been more recently been lifted by technology complexity, particularly as DRAM has moved to 3D architectures. The good news is that pricing, at long last, appears to be driven by value.Automotive MarketWith automotive accounting for less than 10 percent of semiconductor demand, there is room for growth. Rudy Burger of Woodside Partners noted that while the end market for automobiles is growing slowly, at 3 percent CAGR, the market size is nearing 100 million units. In market segments such as electric vehicles, the semiconductor content exceeds $1,000 but can be much higher.For example, the BMW i3 sports over $4,000 in semiconductor content. Burger said connectivity, autonomous driving and shared mobility services are also key opportunities for semiconductors to deepen their penetration in automobiles. For instance, the auto market for cameras, is expected to grow from $2 billion in 2017 to $6 billion in 2022.On average, high-end vehicles feature over $1,000 in semiconductor content, whereas low-end vehicles hover in the $400 range, said Anand Srinivasan of Bloomberg. Because the automotive market is segmented by function or subsystem, with different suppliers focusing on different areas, there is little supply concentration. Srinivasan also pointed out that because of significant differences in their objectives, automotive safety and automation systems should be developed separately.BlockchainThe chief benefit of blockchain is the trust it begets among all parties to a digital transaction through four fundamental features, said David Treat of Accenture: The tracking of provenance (knowing who has touched data, and what has happened to it) Tamper evidence (knowing if someone has tried to change the data) Control (which data elements to share with which parties) Security at the data element level While most of the hype over blockchain focuses on tokenized assets and ledgers (bitcoin and other cryptocurrencies), the fundamental application in the semiconductor industry is sharing trusted access to reference data at the data element level. This ability to provide shared trust can reduce costs throughout the supply chain and across enterprises. For example, future blockchain implementations will offer a full ecosystem view to any supply chain participant. While blockchain has typically been deployed through centralized control or platforms, peer consortia, such as SEMI, could help weave the benefits of blockchain through various ecosystems by enabling equipment and material suppliers, device manufacturers, designers and system integrators to share business and technical information securely and, if desired, anonymously.Global and Macroeconomic TrendsThe biggest threats to the continued growth of the semiconductor industry are exogenous. After a decade of steady recovery since the financial crisis, the global economy appears to be heading for a slowdown. Duncan Meldrum of Hilltop Economics made the case that the global economy is at or just past the peak of the business cycle, and semiconductor equipment is past the peak.A key indicator of a looming recessionary is the movement toward an inverted yield curve, in which long-term interest rates fall below short-term rates – a phenomena that could materialize this year or next.The increasingly heated trade climate, marked by high-stakes confrontations between the U.S. and China, threatens complex supply chain arrangements, though mercurial policy statements could do even more harm than stiffer trade tariffs. Underscoring competing interests between the U.S. and China and the unpredictability of their relations, Robert Maire of Semiconductor Advisors pointed out that, in 2019, 60 percent of all semiconductors are expected to be used in China, deepening the dependency of several U.S. semiconductor companies on China.Paul Semenza, for SEMI Industry Research and Statistics
Read More
Christian G. Dieseldorff, Industry Research Statistics Group, SEMI (June 12, 2018)The semiconductor industry is nearing a third consecutive year of record equipment spending with projected growth of 14 percent (YOY) in 2018 and 9 percent in 2019, a mark that would extend the streak to a historic fourth consecutive growth year, according to the latest update of the World Fab Forecast report published by SEMI. The industry last saw four consecutive years of equipment spending growth in the mid 1990s.Korea and China are leading the growth, with Samsung dominating global spending and ascendant China on a fast, steep rise, surging ahead of all other markets. See figure 1.Figure 1: equipment spending by region (includes new and refurbished)Samsung is expected to reduce equipment investments in 2018. Despite the ebb, the company still accounts for a dominant 70 percent of all investment in Korea. At the same time, SK Hynix is increasing its equipment spending in Korea.China’s equipment spending is forecast to jump a whopping 65 percent in 2018 and 57 percent in 2019. Notably, 58 percent of investments in China in 2018 and 56 percent in 2019 stem from companies with headquarters in other regions such as Intel, SK Hynix, TSMC, Samsung, and GLOBALFOUNDRIES. Domestic, Chinese-owned companies – backed by large government initiatives – are building an impressive number of new fabs that will start equipping in 2018. The companies will double their equipment investments in 2018 and again in 2019.Meanwhile, other regions are also ramping up investments. Japan is beefing up equipment spending by 60 percent in 2018, with the largest increases by Toshiba, Sony, Renesas and Micron.The Europe and Mideastern region will boost investments by 12 percent in 2018, with Intel, GLOBALFOUNDRIES, Infineon and ST Microelectronics as the largest contributors. Southeast Asia will increase investments by more than 30 percent in 2018, although total spending is proportionately smaller than in other regions owing to its size. The main contributors are Micron, Infineon and GLOBALFOUNDRIES, though companies including OSRAM and ams are also increasing investments.The SEMI World Fab Forecast, which also includes information on other companies, covers data and predictions through the end of 2019, including milestones, detailed investments by quarter, product types, technology nodes and capacities down to fab and project level.Learn more about the SEMI fab databases at:www.semi.org/en/MarketInfo/FabDatabase and www.youtube.com/user/SEMImktstats.
Read More