downloadGroupGroupnoun_press release_995423_000000 copyGroupnoun_Feed_96767_000000Group 19noun_pictures_1817522_000000Member company iconResource item iconStore item iconGroup 19Group 19noun_Photo_2085192_000000 Copynoun_presentation_2096081_000000Group 19Group Copy 7noun_webinar_692730_000000Path
Skip to main content
Default Banner Image

SEMI Semiconductor Equipment Forecast

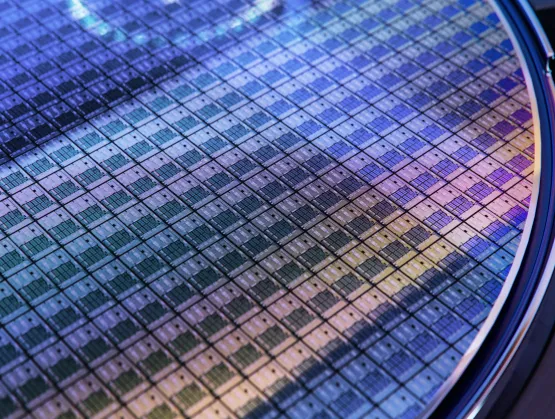
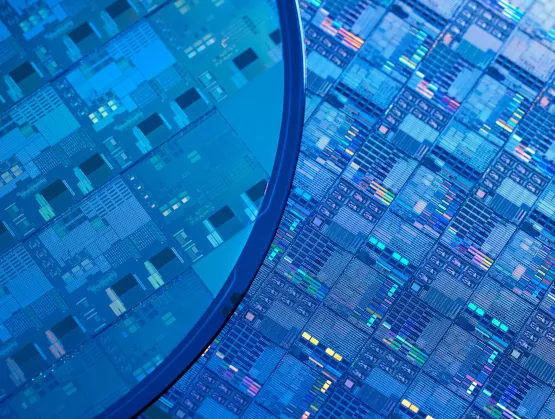
Extended Plateau, Not a New Cycle: The Broader Industry PictureThe current recovery in the semiconductor market appears to signal revival, yet is best understood as an extended phase of the existing cycle—a phase defined less by renewed demand than by structural restraint and efficiency-driven realignment.AI-related demand is indeed driving the rebound, yet this recovery differs fundamentally from past expansionary booms. It is unfolding within an efficiency-driven adjustment phase, where capital expenditure has shifted its focus from capacity expansion to process upgrades and optimization. The observed recovery therefore reflects structural realignment rather than a conventional cyclical upswing.This realignment has created an ‘Extended Peak Plateau’—a state not of cyclical acceleration but of structural transformation. The imbalance between resilient equipment and materials spending and stagnant wafer shipments has produced an uneven recovery, concentrated in select high-value segments rather than evenly across the value chain. The apparent plateau seen today stems less from broad-based demand expansion than from price-anchored growth, sustained by firm pricing in premium segments such as AI-related and high bandwidth memory (HBM) products.At the same time, semiconductor manufacturers—particularly in memory—have adopted a supply-controlled operational strategy, emphasizing process optimization and product upgrades over large-scale capacity additions. Together, these three structural forces—supply/demand imbalance, price-anchored resilience, and efficiency-oriented adaptation—have defined the industry’s current phase, where revenue growth remains elevated but plateaued rather than accelerating or decelerating.In this context, the recent rise in DRAM prices and continued hyperscaler investment hold implications beyond short-term variables: They determine whether the industry can sustain equilibrium without widening the amplitude of future cycles between overheating and contraction. If DRAM recovery remains purely supply-driven, the upturn will likely be shallow; conversely, a slowdown in hyperscaler investment could undermine the demand foundation itself.This is why the report characterizes the current phase not as a “new cycle” but as an extended plateau. While AI-driven momentum has already taken hold, the transition toward a stable and balanced industry structure must pass through the filter of efficiency. This efficiency-based rebalancing will, in all likelihood, require a period of adjustment before a truly sustainable equilibrium — the foundation for the next phase of genuine growth — can emerge.Desynchronization Between Investment and Wafer Demand: Evidence of a Structural ShiftThe chart below visually illustrates this structural asymmetry. When normalized to Q1 2019 = 100, as of Q2 2025 equipment investment has rebounded to roughly 244, photoresist revenue to 200, and total semiconductor revenue to 184—yet wafer shipments remain near 110 and wafer revenue around 103.Diverging Trends Across the Semiconductor Value Chain (Q1 2019 = 100) * Note1. Data sources: SEMI (WWSEMS, Silicon Wafer Shipment, Photoresist Market Data), WSTS, and IR disclosures from the top five wafer suppliers.2. Wafer revenue reflects the aggregated sales of the top five suppliers; Shin-Etsu’s quarterly figures are estimated from 2Q 2021 onward.3. Semiconductor fab equipment investments reflect only wafer-processing equipment (WFE) expenditures, based on the Wafer Processing Equipment category defined in SEMI’s WWSEMS dataset. All indices are normalized to Q1 2019 = 100; wafer area shipments are originally reported in million square inches (MSI), while other indicators represent revenues or investments in U.S. dollars (USD). The data clearly indicate that while equipment and materials have rebounded, wafer shipments and related revenue remain subdued. This divergence is not a matter of cyclical timing; rather, it reflects a re-alignment of the industry’s recovery dynamics, driven by process complexity and efficiency-oriented capital deployment. In other words, the widening gap between investment and wafer industry output symbolizes the industry’s transition from expansion-driven growth to efficiency-driven operations.In previous cycles, the linear linkage of “investment expansion → production expansion” prevailed. Today, however, investment is now synonymous with process-efficiency improvement rather than capacity growth. Behind this shift lie longer cycle times, rising process complexity, and the increasing concentration of demand in AI-related nodes. More complex manufacturing now requires process sustainment, advanced process control, and continual upgrades—CapEx allocation now reflects this shift.At the same time, a clear gap has emerged between wafer revenue and shipment growth, underscoring the divergence between financial recovery and physical output. In other words, shipment volumes have improved, but average selling prices remain subdued, signaling that the recovery is not demand-driven. This indicates that the current phase is sustained not by broad-based demand expansion, but by selective growth achieved through efficiency gains and product-mix adjustments. Despite this widening gap, the industry may give the outward impression of a steady growth plateau, since CapEx spending and high-value segments continue to post solid growth. Yet what appears as stable growth in the semiconductor and equipment market could be, in fact, a structural illusion—a state shaped by process complexity, efficiency-driven investment, and deliberate product-mix management. In short, this perceived growth is the by-product of financial and supply discipline, not the result of renewed demand momentum.Realignment of the Wafer Industry: A Gradual 300 mm-Led Shift Anchored in Efficiency and Portfolio StrategyAs the broader semiconductor ecosystem shifts its focus from expansion to efficiency—and from scale to high value and customer reliability—wafer manufacturers are, in turn, redefining their competitive edge around operational efficiency and the stable delivery of high-value products. The 300 mm wafer segment continues to lead the recovery, whereas 200 mm wafer shipments remain significantly below its 2022 peak, constrained by sluggish demand from legacy and non-memory applications. On the profitability front, depreciation burdens and persistent pricing pressure are creating dual headwinds.To navigate this environment, leading wafer suppliers are pursuing a dual-track approach: renegotiating long-term supply agreements (LTAs) while managing short-term contracts and selective and disciplined pricing to sustain utilization. At the same time, they are optimizing product portfolios to balance cash-flow defense with strategic offense. In this context, the critical question is shifting from “How much can be sold?” to “What kind of portfolio—specifically, how consistently can high-value wafers be sold and delivered?”In essence, performance is now measured less by expansion and investment scale, and more by efficiency, sustainability, and reliability. This strategic realignment mirrors the broader efficiency-driven transition underway across the semiconductor value chain, underscoring that the wafer industry is no exception to the global shift toward disciplined, portfolio-centric growth.Conclusion: The Path to True Recovery — When Three Forces AlignIn summary, the current semiconductor market is best understood as having entered an extended plateau following the peak of the present cycle, with its future trajectory hinging on how effectively DRAM price resilience and Big Tech investment continuity can restore balance. In essence, the outcome will depend on the market’s ability to narrow the amplitude between overheating and contraction, moving toward a more sustainable equilibrium. Rather than focusing on the DRAM price rebound driven primarily by supply adjustments or on demand concentrated in specific sectors, what truly matters for the wafer industry is the structural alignment of three key forces: (1) the recovery of broad-based and genuine demand, (2) the stabilization of the semiconductor supply structure, and (3) the improvement of operational efficiency across the value chain. The moment these three forces align will signal the true onset of the next upcycle — not only for the broader semiconductor market, but also for the global silicon wafer industry.Such alignment rarely occurs quickly — it requires time, discipline, and structural patience.This article distills the key insights from the Market Update section of the Q3 2025 Silicon Wafer Market Monitor Report. In this quarter’s analysis, the focus lies on the semiconductor cycle’s transition into an Extended Peak Plateau — a phase characterized not by broad-based expansion, but by efficiency-driven operations and portfolio realignment. Drawing on shipment, revenue, and CapEx data across wafers, materials, and equipment, this section identifies structural asymmetries between investment and shipment dynamics, and explores how efficiency gains, product-mix optimization, and supply discipline are reshaping the industry’s recovery trajectory.Separate from this focused article, the full SEMI Silicon Wafer Market Monitor Report provides a wider array of charts and indicators, offering a multidimensional perspective on how key variables interact to shape the future of the global wafer industry. Rather than serving as background commentary, the full report aims to deliver data-driven, decision-ready insights that support strategic thinking amid persistent market uncertainty.For more information on the report or to subscribe, please contact the SEMI Market Intelligence Team at [email protected]. Details on SEMI market data are available at SEMI Market Data. Sungho Yoon is a Principal Analyst on the SEMI Market Intelligence team.
Read More
The semiconductor industry faces an unprecedented paradox: AI demand is booming, fab investments are rising, yet wafer shipments remain stubbornly flat. What's driving this disconnect, and when will it break?As of mid-2025, the global silicon wafer market appears calm on the surface, but underlying structural tensions are quietly mounting. The demand for AI semiconductors remains resilient, and certain high-value supply chains continue to operate near capacity. Yet wafer shipments have shown little sign of meaningful recovery—a divergence that raises questions about the conventional supply-demand playbook.SEMI's latest Silicon Wafer Market Monitor Report begins with a structural hypothesis: that the current market dynamics cannot be explained solely by weak demand or delayed orders. Instead, we propose that the demand pattern of fab operations itself has fundamentally changed.The Hidden Constraint: Time ExtensionOne critical metric has emerged as a structural bottleneck—fab cycle time, or the average duration for a wafer to complete its full process flow. Our quantitative analysis reveals that since 2020, fab cycle times have grown at a compound annual growth rate of 14.8%. This represents a fundamental deceleration in fab throughput, meaning that even with the same number of tools and consistent utilization rates, the volume of wafers that can be processed is now structurally constrained.Why is this happening? Rising process complexity, increased equipment density, and tighter quality control requirements are absorbing more capital per wafer while paradoxically slowing production. Equipment spending per wafer area has surged over 150% since 2020, yet this investment translates into longer processing times rather than higher throughput.The High Bandwidth Memory (HBM) Economic ThresholdSimultaneously, the market is approaching a new inflection point driven by the rapid rise of HBM. HBM wafers consume over three times more wafer area per bit compared to standard DRAM, creating potentially significant wafer demand. However, HBM currently accounts for just 16% of total memory revenue—still below a critical economic threshold.Our analysis identifies that when HBM reaches 25% of total memory revenue, the trade ratio rises to 1.5. This is the structural breakeven point where CapEx per wafer for HBM-dedicated lines aligns with standard DRAM economics. At this threshold, memory makers gain clear incentives to expand wafer input, and customers become more willing to pay premium prices.The Quantitative FrameworkInstead of relying on conventional forecasts, we model the interaction of four critical variables—HBM penetration, DRAM bit growth, fab utilization, and cycle time—using a quantitative simulation framework. Under current conditions (16% HBM revenue share, 15% annual bit growth, 95% fab utilization, and 14.8% cycle time increase), wafer input would need to increase by 23.9% annually to meet projected demand.Yet no fab is scaling wafer input to that extent today. This suggests the market isn't demand-constrained but operating within a conditionally responsive system—one that won't activate until key thresholds align.Beyond Economics: Technical and Operational ReadinessThe slow pace of HBM expansion isn't solely about investment timing. Technical constraints including low yields, delayed customer qualification, and process stabilization challenges also play critical roles. These preconditions—investment readiness, yield optimization, and qualification completion—haven't yet aligned, keeping the market in strategic latency despite robust underlying demand.Additional factors compound this delay. Backend bottlenecks in Chip-on-Wafer-on-Substrate (CoWoS) packaging are causing semi-finished wafers to accumulate as inventory, constraining upstream wafer input. At the fab level, companies prioritize efficiency gains through process conversions over new construction. Meanwhile, macroeconomic uncertainty, geopolitical tensions, and foreign exchange volatility continue suppressing capital execution.The Three-Tier Response ModelThis structural shift creates a three-tier demand response across the supply chain:Wafer demand: Conditionally responsive, awaiting economic threshold alignmentEquipment investment: Process-transition driven, already responding to complexity increasesMaterials demand: Directly tied to cycle time extensions, with potential for early bottlenecksFor certain process-critical materials like EUV photoresists and TSV chemicals, supply constraints may emerge even before wafer input fully ramps, preceding equipment expansion.Strategic ImplicationsFor industry stakeholders, this analysis suggests three key actions: wafer suppliers should prepare scenario-based capacity plans around the 25% HBM threshold; equipment makers should anticipate process-transition driven demand regardless of current wafer volumes; and materials suppliers should prepare for potential bottlenecks as extended cycle times increase consumption per wafer.Crucially, the current stagnation shouldn't be interpreted as structural decline. Rather, the market exists in a state of strategic readiness, with key conditions not yet aligned. Once they are, wafer demand will likely respond nonlinearly—and momentum is already building in that direction.The structural inflection point (≈25% HBM penetration) and cycle time increase (+14.8%) serve as forward-looking indicators not just for wafer producers, but for the entire upstream supply chain. The question isn't whether this inflection will occur, but when. Companies that understand these structural dynamics and prepare accordingly will be best positioned to capitalize on the nonlinear demand response when it arrives.These key insights are from the market update section of the Q2 2025 Silicon Wafer Market Monitor Report. This quarter's analysis models structural inflection points using scenario-based projections across nine core charts and tables, offering data-driven perspective on the industry's readiness for the next demand shift. Download your free sample report today.For more information on the report or to subscribe, please contact the SEMI Market Intelligence Team at [email protected]. Details on the complete SEMI market data portfolio are available at our Market Intelligence website. Sungho Yoon is a Principal Analyst in the Silicon Wafer Market Research at SEMI Market Intelligence.
Read More
The semiconductor industry has long followed a well-defined cyclical structure. Typically, price declines lead to a contraction in capital expenditure, followed by inventory normalization and eventual recovery. This repeated pattern—comprising pricing correction, investment pullback, inventory adjustment, and eventual market rebound—continues to offer a relevant lens through which to interpret the current uncertain market environment.As of April 2025, the industry faces a mix of conflicting signals. Concerns are rising that AI-related demand may have already peaked, while cautious optimism persists over a possible rebound in DRAM prices in the second half of the year. These market dynamics are further complicated by rising macroeconomic uncertainty, including renewed trade friction between the U.S. and China, reemerging tariff risks, and persistent inflationary pressure. In such a complex and volatile environment, the importance of cycle-based structural analysis has never been greater.Viewed from a momentum perspective, the recovery in semiconductor equipment investment—marked by a rebound in year-over-year growth (measured on a 12-month moving average basis) beginning in mid-2024—can be interpreted as a potential sign of renewed demand. However, this apparent stability may be misleading. While global companies significantly curtailed their fab investments throughout the second half of 2023 and the first half of 2024, China moved in the opposite direction, intensifying state-led expansion efforts aimed at achieving semiconductor self-sufficiency. This divergence in investment behavior has distorted the global capital expenditure landscape, potentially creating the impression of a broader recovery, while in reality the momentum remains concentrated in a single region driven by policy rather than market fundamentals.Similarly, the recent uptick in DRAM pricing appears to be driven more by production cuts than demand-side momentum. Major suppliers have been deliberately scaling back output to manage inventory and support pricing. In this context, price rebounds not backed by end-market demand are unlikely to sustain a meaningful recovery in wafer procurement. Simulation results—based on second-half projections—suggest that unless DRAM blended ASP increases by more than 20% quarter-over-quarter in both Q3 and Q4 2025, a meaningful upward inflection in the year-over-year pricing trend (on a 12-month moving average basis) remains improbable. This highlights the fragility of the current price recovery suggests that without a meaningful improvement in end-market demand—particularly for DRAM—wafer procurement for DRAM production is unlikely to recover in a sustained manner, regardless of supply-side actions. As SEMI highlights in this Silicon Wafer Market Monitor Report, a deeper understanding of the wafer market requires a close examination of raw material inventory trends. The inventory behavior of memory makers—due to their dominant scale and transparency—is widely regarded as a proxy for broader semiconductor industry trends. Following the pandemic, memory makers' raw material stockpiles surged to levels equivalent to five times their historical average relative to sales. While these ratios were significantly reduced between 2023 and 2024, inventory levels still meaningfully exceed pre-pandemic norms. With leading players signaling further inventory drawdowns, there is little incentive to rebuild raw material stockpiles—including silicon wafers—unless there is clear evidence of sustained demand recovery.This inventory dynamic is closely tied to wafer shipment growth. Historical data reveals a strong inverse relationship between raw material inventory-to-sales ratios at the top three memory makers—Samsung, SK hynix, and Micron—and wafer shipments. When this ratio declines year-over-year, wafer shipment growth typically improves. However, a slowdown in the pace of inventory ratio reduction could result in stagnant or declining wafer shipment growth in subsequent periods.Moreover, even as these inventory ratios continue to decline, wafer average selling prices (ASPs) have yet to show signs of recovery. This decoupling of pricing from inventory adjustments reflects the presence of a structural imbalance in supply and demand. On the supply side, all top five global wafer producers have secured greenfield fab capacity and are prepared to scale production. With depreciation pressures mounting, they face strong incentives to maintain economically viable utilization rates, contributing to ongoing ASP erosion.Meanwhile, chip capacity expansion in China—primarily driven by demand for 200mm applications—is adding further downward pressure. Chinese wafer suppliers, who already hold a meaningful share in China’s 200mm market, are now directing more of their investment toward 300mm wafer production—intensifying price pressure and adding to the longer-term competitive pressures facing global suppliers. This focus aligns with China’s broader push into mature process nodes, even as demand outside the region remains tepid. Accordingly, local Chinese wafer suppliers are competing aggressively on price, weakening the regional competitiveness of established global wafer players.As a result, the competitive landscape is undergoing a structural shift: global wafer suppliers are contending with intensified price-based competition among themselves in non-China markets, while simultaneously coming under mounting pressure from Chinese local players within China. This dual-front competition highlights the threshold point the industry has reached—where traditional pricing models and market dynamics are being fundamentally challenged.Moreover, long-term supply agreements (LTAs), once effective tools for pricing stability, are expected to gradually lose relevance. As semiconductor manufacturers—who purchase wafers under LTAs—move toward shorter-term and more customized purchasing models, and as pricing volatility increases, the incentive to commit to such agreements is projected to steadily diminish. The market, therefore, is not yet in a phase of strong recovery but appears to be undergoing a structural transition defined by persistent imbalances. The full report presents three scenario-based outlooks centered on four key variables—DRAM pricing, inventory normalization, equipment investment, and China’s regional influence. The most probable scenario currently assumes modest growth in 2025–2026, a correction in 2027, and a recovery in 2028. Wafer shipment growth rates under this scenario are projected at +5.1%, +5.4%, –6.2%, and +9.8%, respectively.However, even this base case remains vulnerable to potential macroeconomic disruptions. The large-scale tariff measures announced by the U.S. in April 2025 could trigger cascading effects across the ecosystem—from weakening enterprise demand and delaying infrastructure investments to softening DRAM prices and curbing wafer procurement. In past cycles, leading macro indicators such as the OECD Composite Leading Indicators (CLI) tended to lead DRAM price movements. If macro momentum slows, the market could deviate from the base case and move closer to the downside scenario. This downside scenario assumes weak or negative growth through 2026, a moderate recovery in 2027, and a stronger rebound by 2028 as supply-demand conditions begin to normalize.The current market trajectory suggests limited room for either sharp declines or sharp rebounds. The next phase will depend on how four forces interact: DRAM price momentum, inventory rebalancing pace, regional investment activity, and policy risks. A clear inflection point will only emerge when these factors begin to align. In other words, a meaningful shift—either upward or downward—will only occur when these forces move in the same direction and reinforce one another. Ultimately, any directional shift—whether delayed or accelerated—will still unfold within the broader framework of the semiconductor cycle previously discussed. In that sense, these indicators do not reverse the cycle itself; they merely influence the timing and pace at which it plays out.This article presents a summary of key insights from the Q1 2025 Market Update section of the SEMI’s Silicon Wafer Market Monitor Report, which is compiled in PowerPoint format and distributed as a PDF. In this edition, scenario-based analysis was used to navigate growing macroeconomic uncertainty and assess potential turning points in wafer demand. To support this analysis, the Market Update section presents 10 core quantitative charts and long-term data series dating back to 2000—particularly curated to visualize and analyze semiconductor revenue, investment, and pricing cycles in a single view. Separate from this focused section, the full SEMI’s Silicon Wafer Market Monitor Report includes a much broader array of charts and indicators, providing a multi-dimensional analysis of how fundamental variables interact to shape the future of the silicon wafer industry. Rather than simply offering background explanation, the full report is intended to provide clear, data-driven insights that can support strategic thinking amid market uncertainty.For more information on the report or to subscribe, please contact the SEMI Market Intelligence Team at [email protected]. Details on SEMI market data are available at SEMI Market Data. Sungho Yoon is a Principal Analyst on the SEMI Market Intelligence team.
Read More
The silicon wafer market showed promising signs of recovery in Q2 2024, bouncing back after a prolonged downturn. The growth is fueled by seasonal factors and strong demand from investments in AI data centers, however, the consumer, automotive, and industrial segments are experiencing a slower pace of recovery. Historically, year-over-year (YoY) growth in semiconductor equipment investments tends to hit a low point before rebounding and typically contributing to an upward trend in wafer shipments. Figure 1 depicts this trend since 2001, with the only exceptions to wafer shipments following the rebound of fab equipment spending coming in the periods of the second and third quarters in 2002 and 2013, which are highlighted in gray. Figure 1* Notes 1) Data source: SEMI WWSEMS and SMG wafer shipments data 2) For semiconductor equipment spending, data from 2001 to 2024 is based on WWSEMS wafer processing equipment billing data 3) Equipment spending is updated through August 2024 This pattern underscores the crucial role of equipment investments in expanding production capacity and driving wafer demand. Following the rebound in equipment investment growth rates observed in 2024, projections indicate continued growth into 2025. This recovery in investments is expected to translate into increased wafer shipments, reinforcing a positive outlook for the silicon wafer market’s sustained growth.Additionally, the influence of DRAM Blended ASP (Average Selling Price) growth trends on wafer demand is significant. The historical data in Figure 2 shows that when DRAM ASP growth rates peak and then decline, wafer shipment growth tends to slow down after a lag. Figure 2* Remarks 1) Data source: SEMI SMG wafer shipments data and the Bank of Korea 2) DRAM ASP is updated through September 2024. With DRAM pricing potentially entering a downward trend in early 2025, this poses a key risk to the pace of the wafer market’s recovery. Looking ahead, wafer shipment growth is expected to vary by wafer type and diameter, with low to mid-double-digit growth projected for 2025, mid-to-high single-digit growth for 2026, and a notable slowdown in 2027. This forecast reflects evolving demand dynamics and ongoing market adjustments.In conclusion, the sustained recovery of the silicon wafer market hinges on a combination of increasing semiconductor equipment investments, the stabilization of raw material inventory levels among chipmakers, and careful monitoring of DRAM pricing trends. While the current upward trend in equipment investments is a positive driver for wafer shipments, the potential deceleration of DRAM Blended ASP growth poses a significant downside risk. If DRAM pricing exerts a sustained negative influence, it could shorten both the amplitude and duration of the current wafer market upcycle more than anticipated. This report not only examines these key investment and shipment dynamics but also provides an in-depth analysis of broader market trends, including supply-demand balances and pricing dynamics. By addressing these interconnected factors, it offers a comprehensive and forward-looking perspective on the long-term growth potential of the silicon wafer market.SEMI’s Silicon Wafer Market Monitor Report offers unique insights into global silicon wafer shipments, supply and demand dynamics, and average selling price (ASP) projections. This comprehensive quarterly report breaks down silicon shipments by region and wafer size, including 300mm, 200mm, and 150mm wafers, providing a detailed view of the market landscape.Semiconductor manufacturers, investors, and industry analysts rely on this report as an essential tool for making informed business decisions and exploring the latest data and trends shaping the future of the semiconductor industry.Download a sample of the Semiconductor Manufacturing Monitor report. For more information on the report or to subscribe, please contact the SEMI Market Intelligence Team at [email protected]. Details on SEMI market data are available at SEMI Market Data. Sungho Yoon is Principal Analyst on the SEMI Market Intelligence team.
Read More