

Broad Global & U.S. Electronic Supply Chain Growth
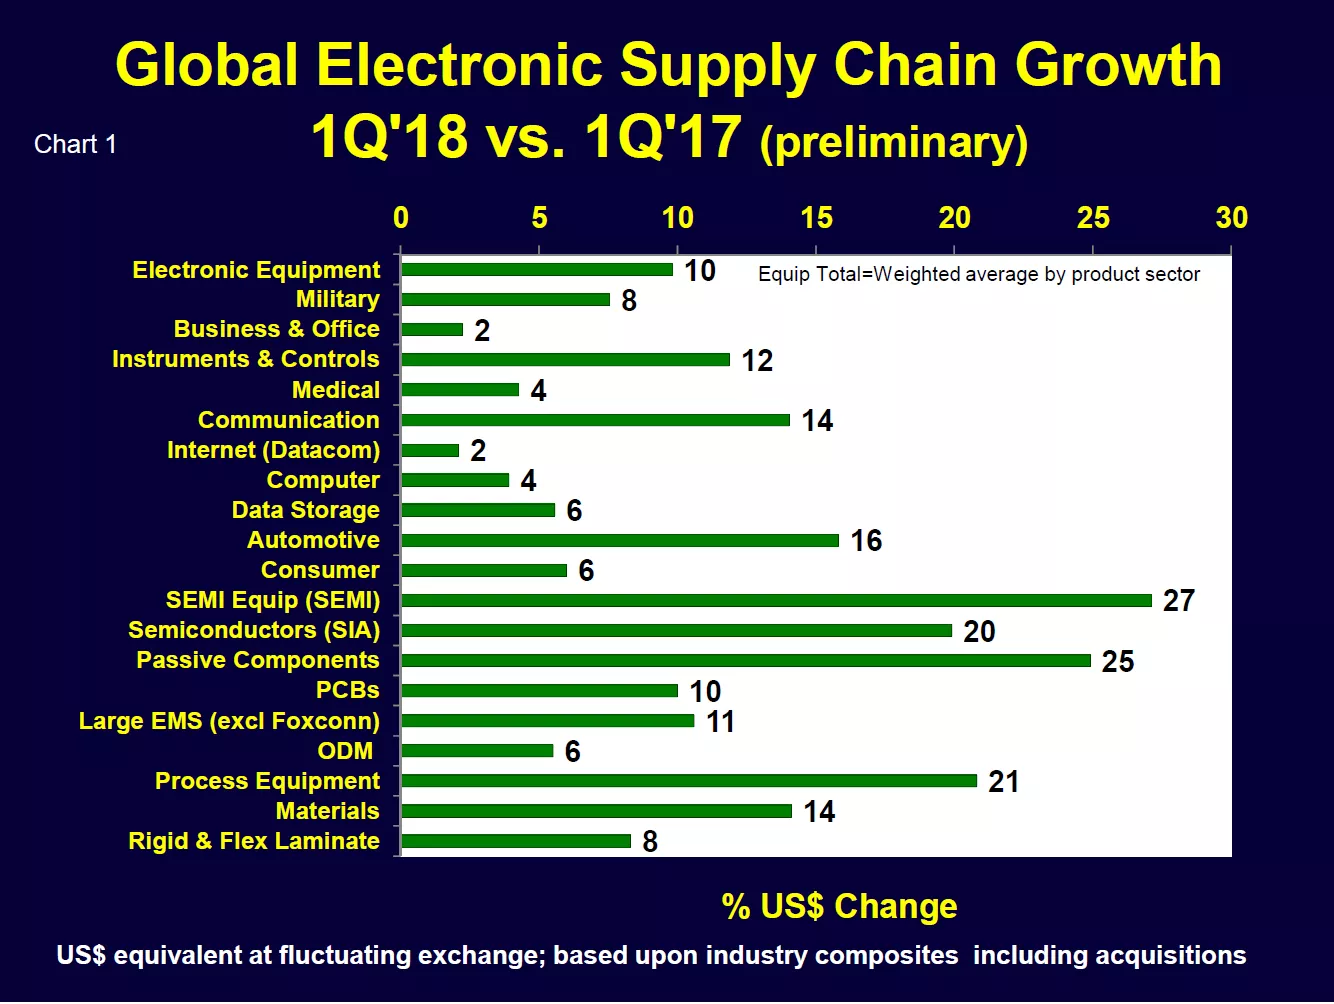
The first quarter of this year was very strong globally, with growth across the entire electronics supply chain. Although Chart 1 is based on preliminary data, every electronics sector expanded – with many in double digits. The U.S. dollar-denominated growth estimates in Chart 1 have effectively been amplified by about 5 percent by exchange rates (as stronger non-dollar currencies were consolidated to weaker U.S. dollars), but the first quarter global rates are very impressive nonetheless.
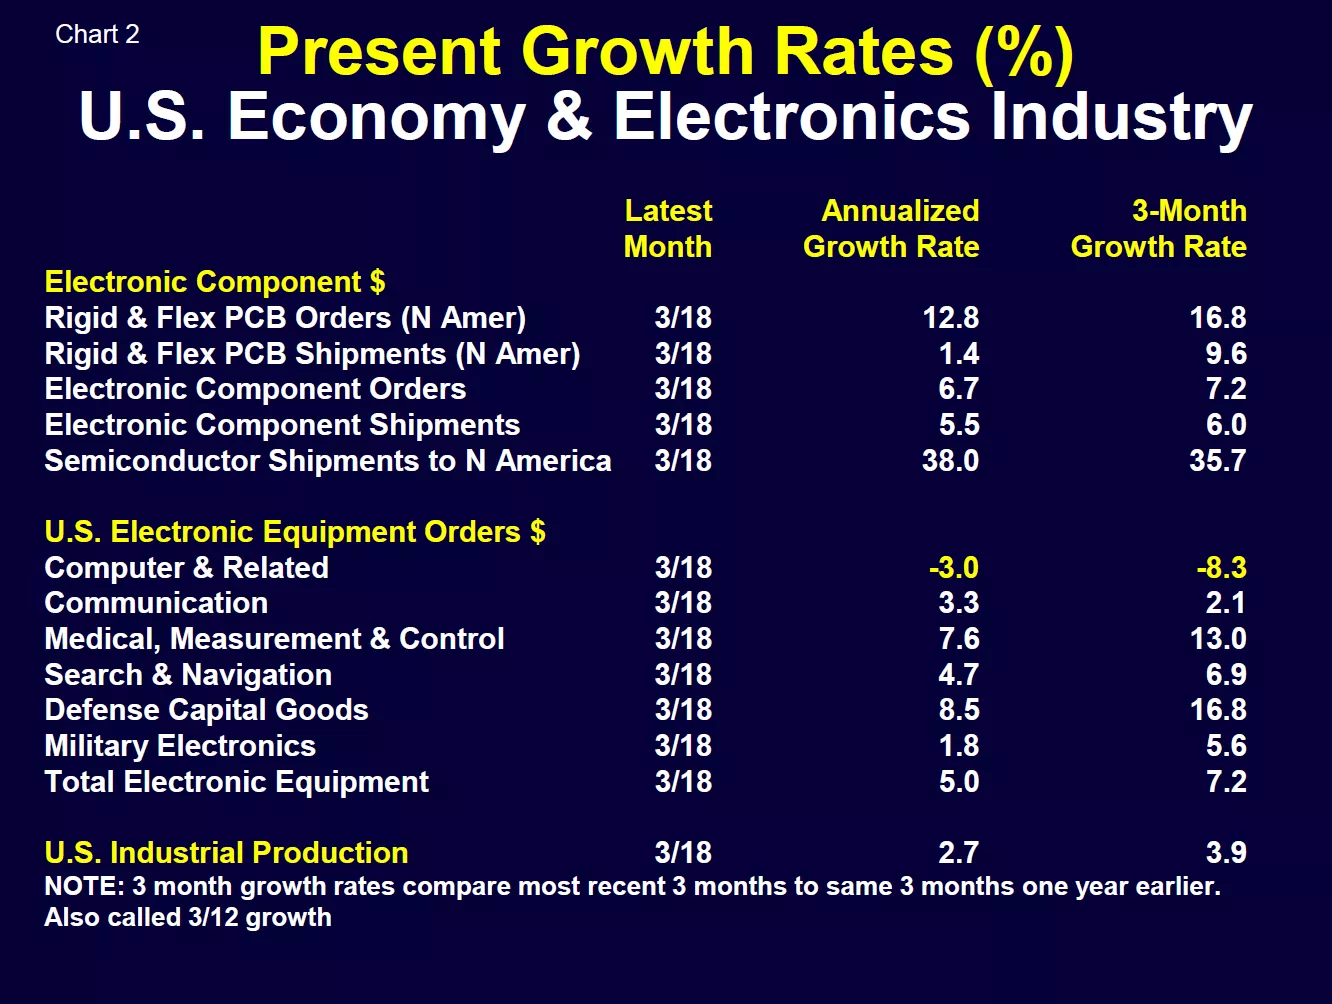
U.S. growth was also good (Chart 2) with Quarter 1 2018 total electronics equipment shipments up 7.2 percent over the same period last year. Since all the Chart 2 values are based on domestic (US$) sales, there is no growth amplification due to exchange rates.
We expect continued growth in Quarter 2 but not at the robust pace as the first quarter.
Chip Foundry Growth Resumes
Taiwan-listed companies report their monthly revenues on a timely basis – about 10 days after month end. We track a composite of 14 Taiwan Stock Exchange listed chip foundries to maintain a “pulse” of this industry (Chart 3).
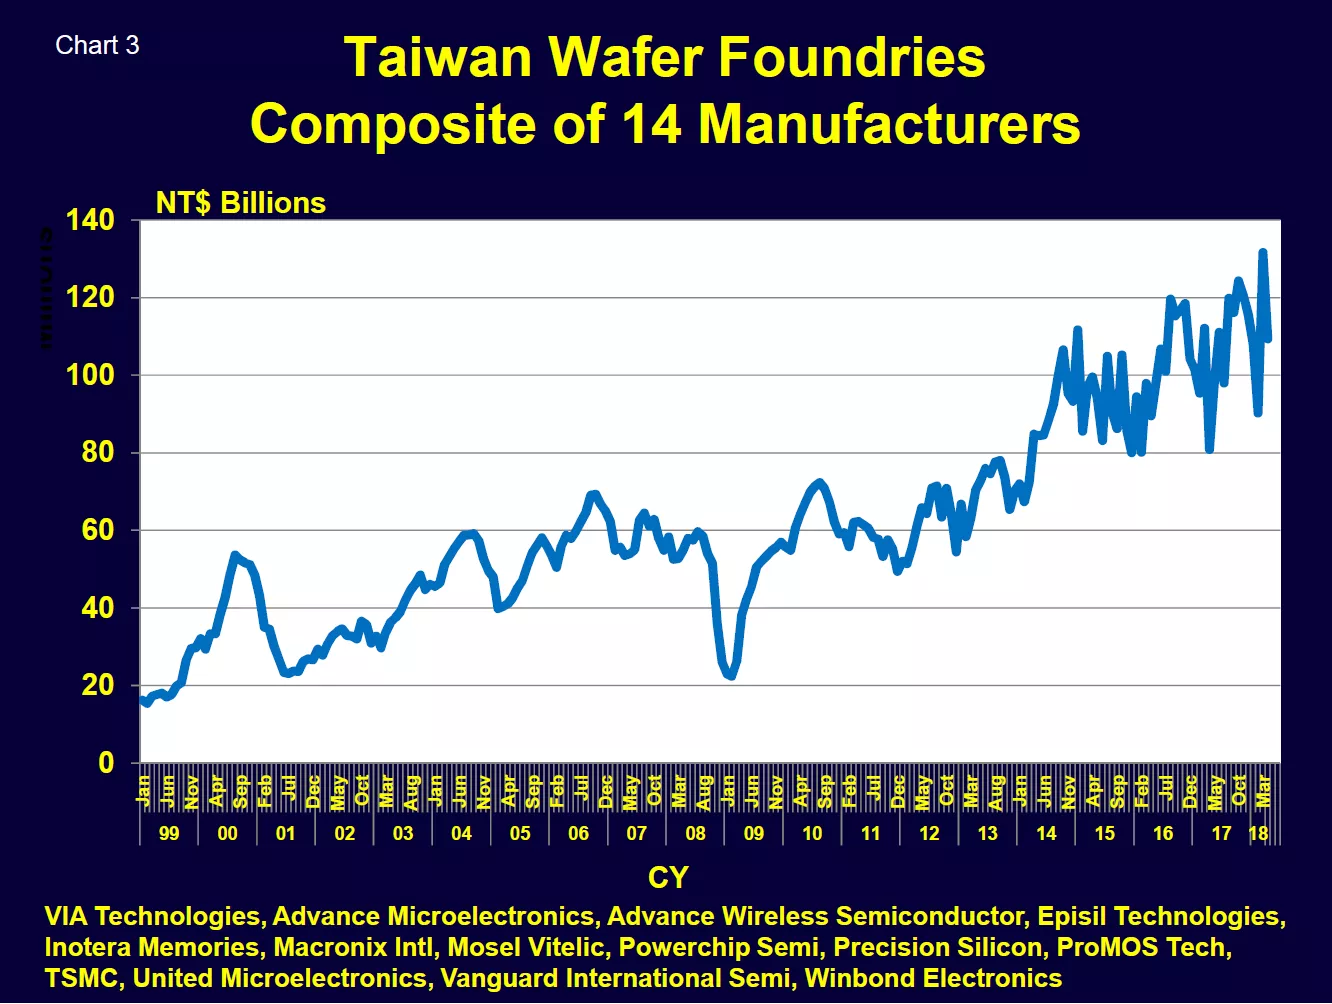
Chip foundry sales have been a leading indicator for global semiconductor and semiconductor capital equipment shipments. After dropping to near zero in mid-2017, foundry growth is now rebounding.
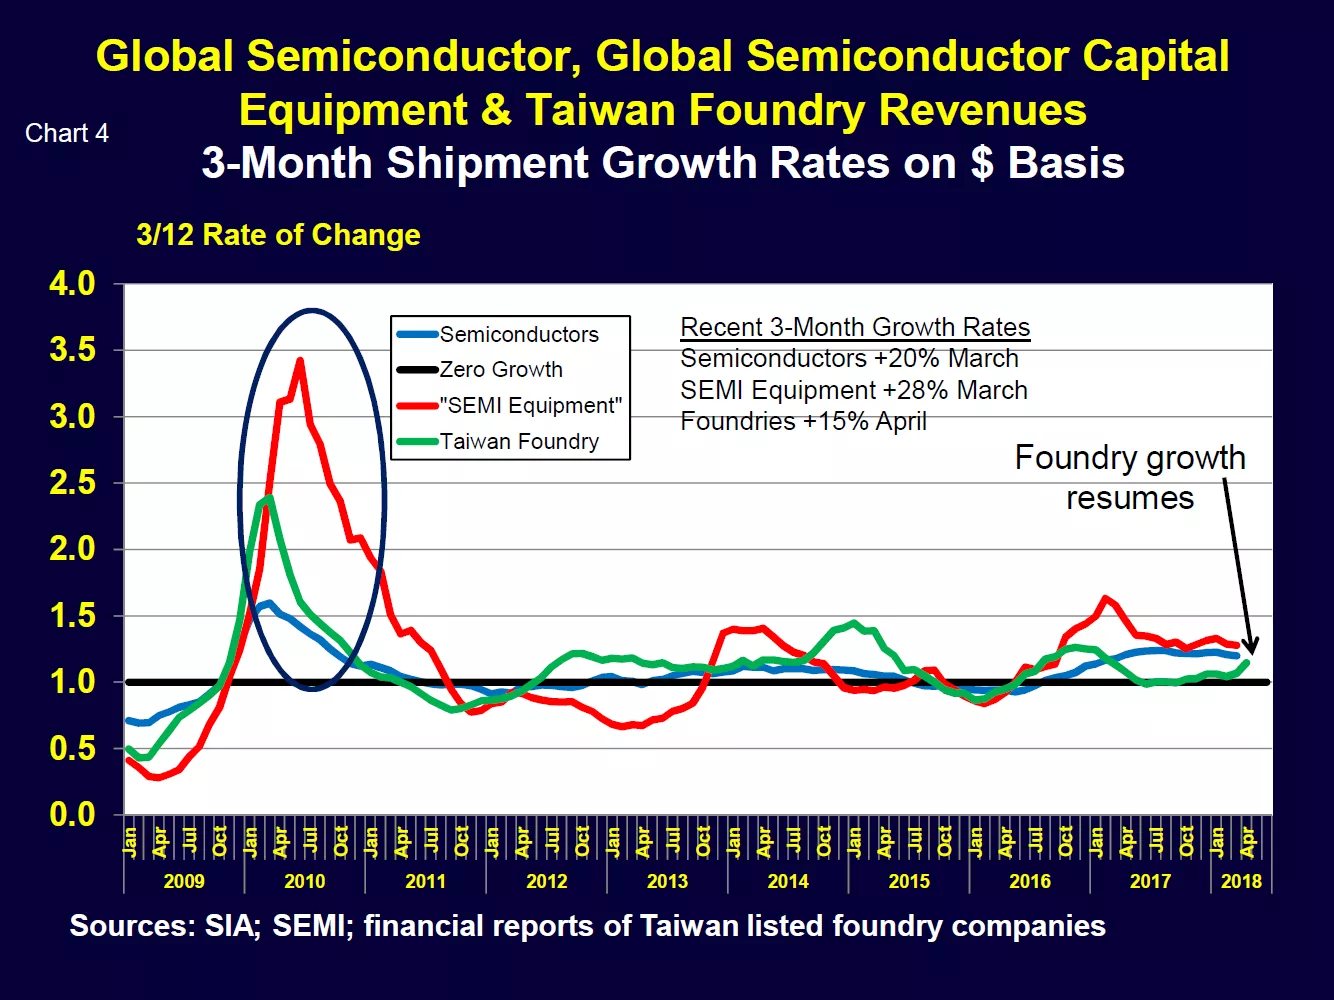
Chart 4 compares 3/12 (3-month) growth rates of global semiconductor and semiconductor equipment sales to chip foundry sales. The foundry 3/12 has historically led semiconductors and SEMI equipment and is pointing to a coming cyclical upturn. It will be interesting to see how China’s semiconductor industry buildup impacts this historical foundry leading indicator’s performance.
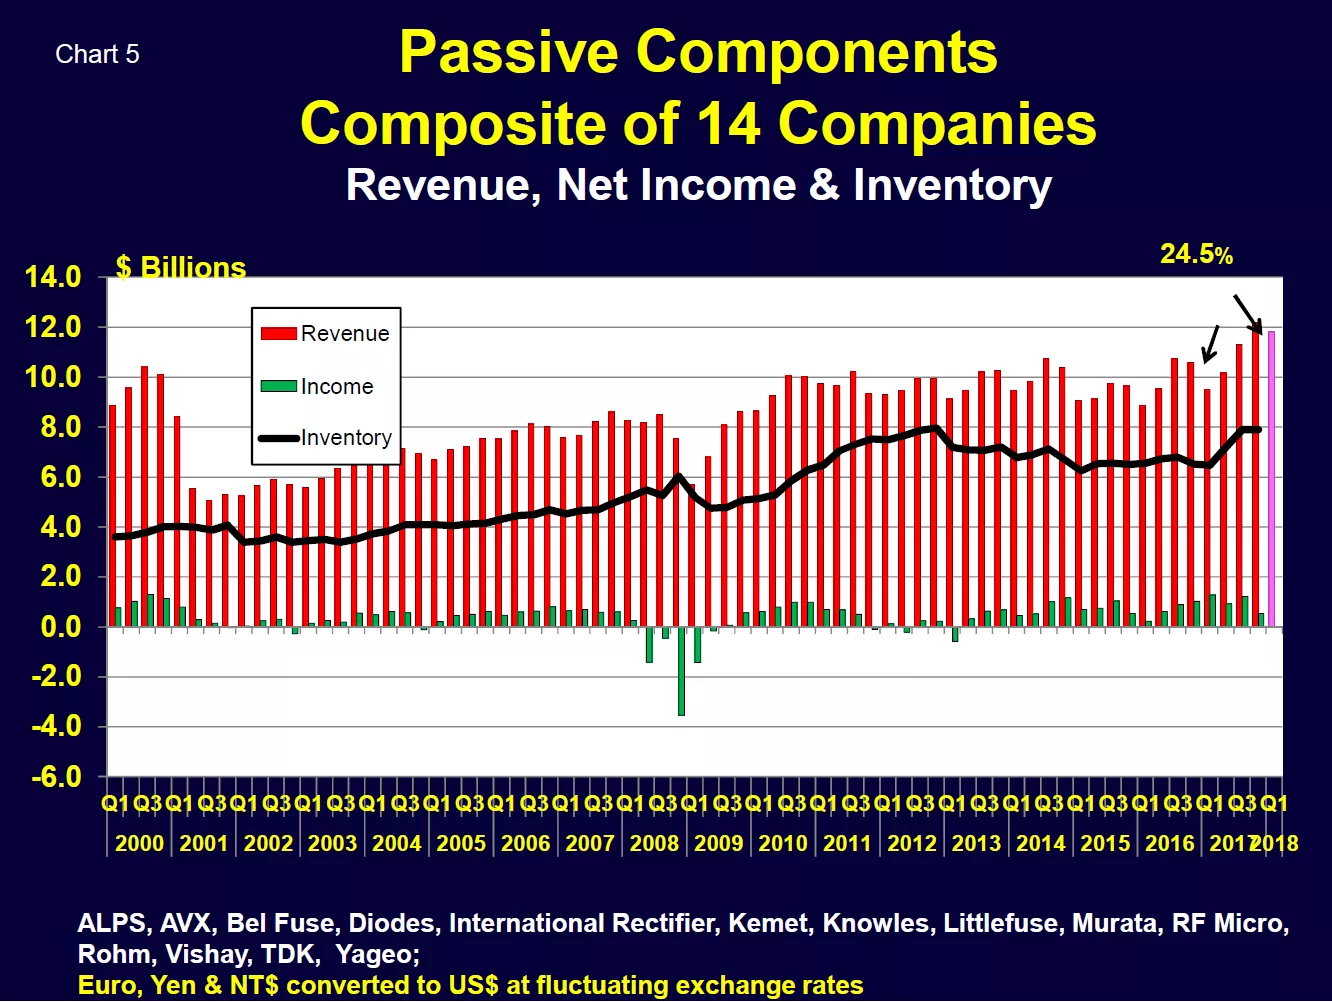
Passive Component Shortages and Price Increases
Passive component availability and pricing are currently major issues. Per Chart 5, Quarter 1 2018 passive component revenues increased almost 25 percent over the same period last year. Inadequate component supplies are hampering many board assemblers with no short-term relief in sight.
Peeking into the Future
Looking forward, the global purchasing managers index (a broad leading indicator) has moderated but is still well in growth territory.
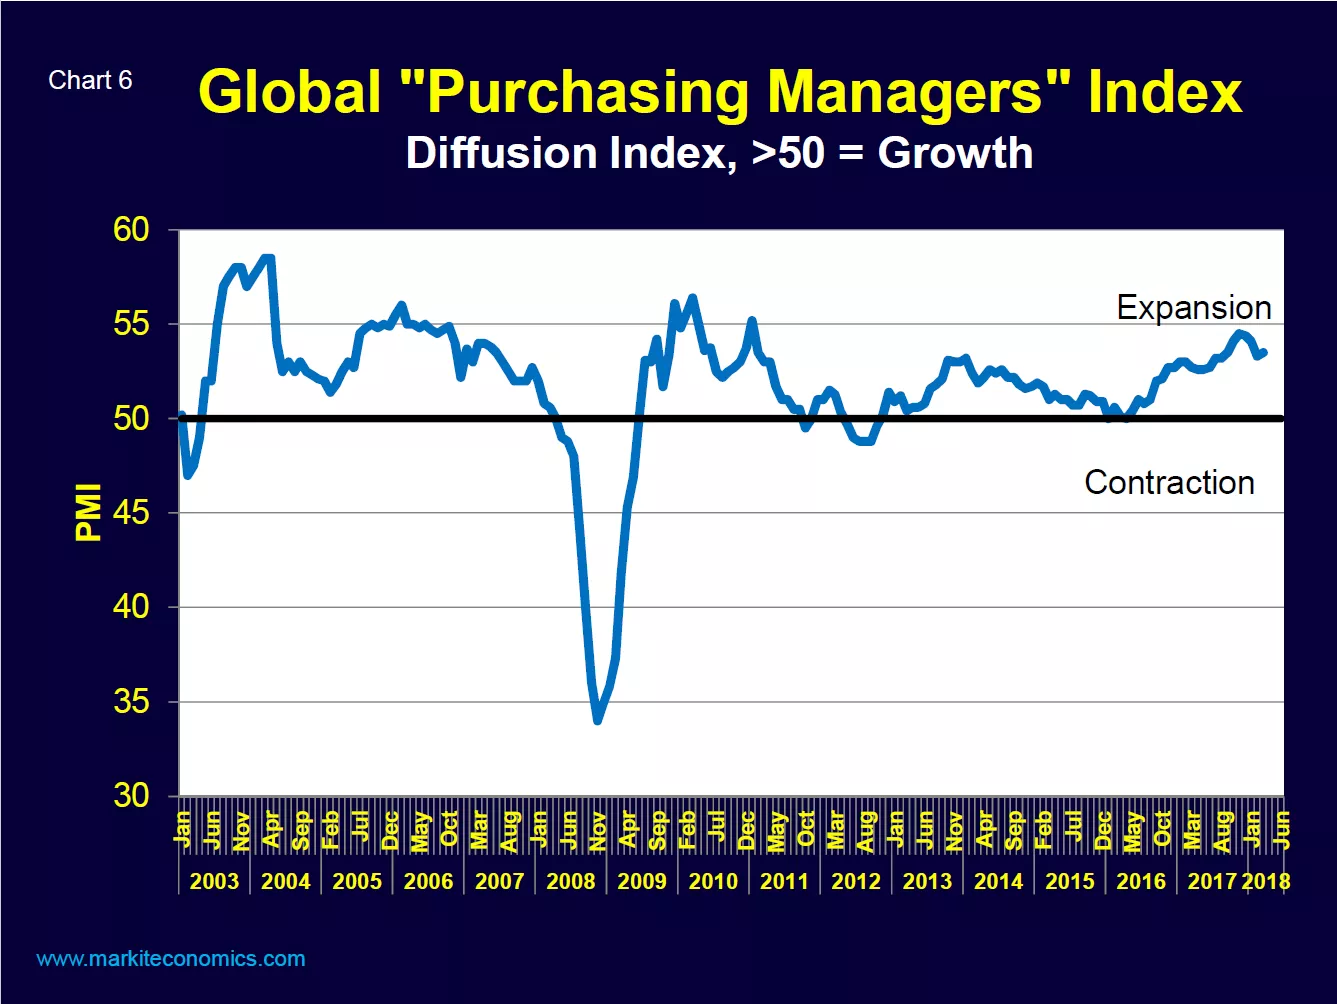
The world business outlook remains positive but requires continuous watching!
Walt Custer of Custer Consulting Group is an analyst focused on the global electronics industry.


